

Key Points
- Bitcoin cash price traded higher and it recently broke the $655 resistance against the US Dollar.
- There is a key bullish trend line forming with support at $660 on the hourly chart of the BCH/USD pair (data feed from Kraken).
- The pair may continue to move higher and it could even break the $700 barrier in the near term.
Bitcoin cash price is showing positive signs above $650 against the US Dollar. BCH/USD might accelerate higher above the $700 level soon.
Bitcoin Cash Price Trend
There was a decent support base formed around the $600 level in bitcoin cash price against the US Dollar. The price started an upside move and traded above the $620 and $640 resistance levels. The best part was a break above the $650 resistance, which opened the doors for more gains. Moreover, there was a close above the $650 level and the 100 hourly simple moving average.
Most importantly, the price is now above the 50% Fib retracement level of the last drop from the $724 high to $600 low. At the moment, the price is trading near $675 and it may continue to move higher. On the downside, there is a key bullish trend line forming with support at $660 on the hourly chart of the BCH/USD pair. However, the most important support is now at $650, which was a resistance earlier. Moreover, the $630 level and the 100 hourly SMA are also crucial supports.
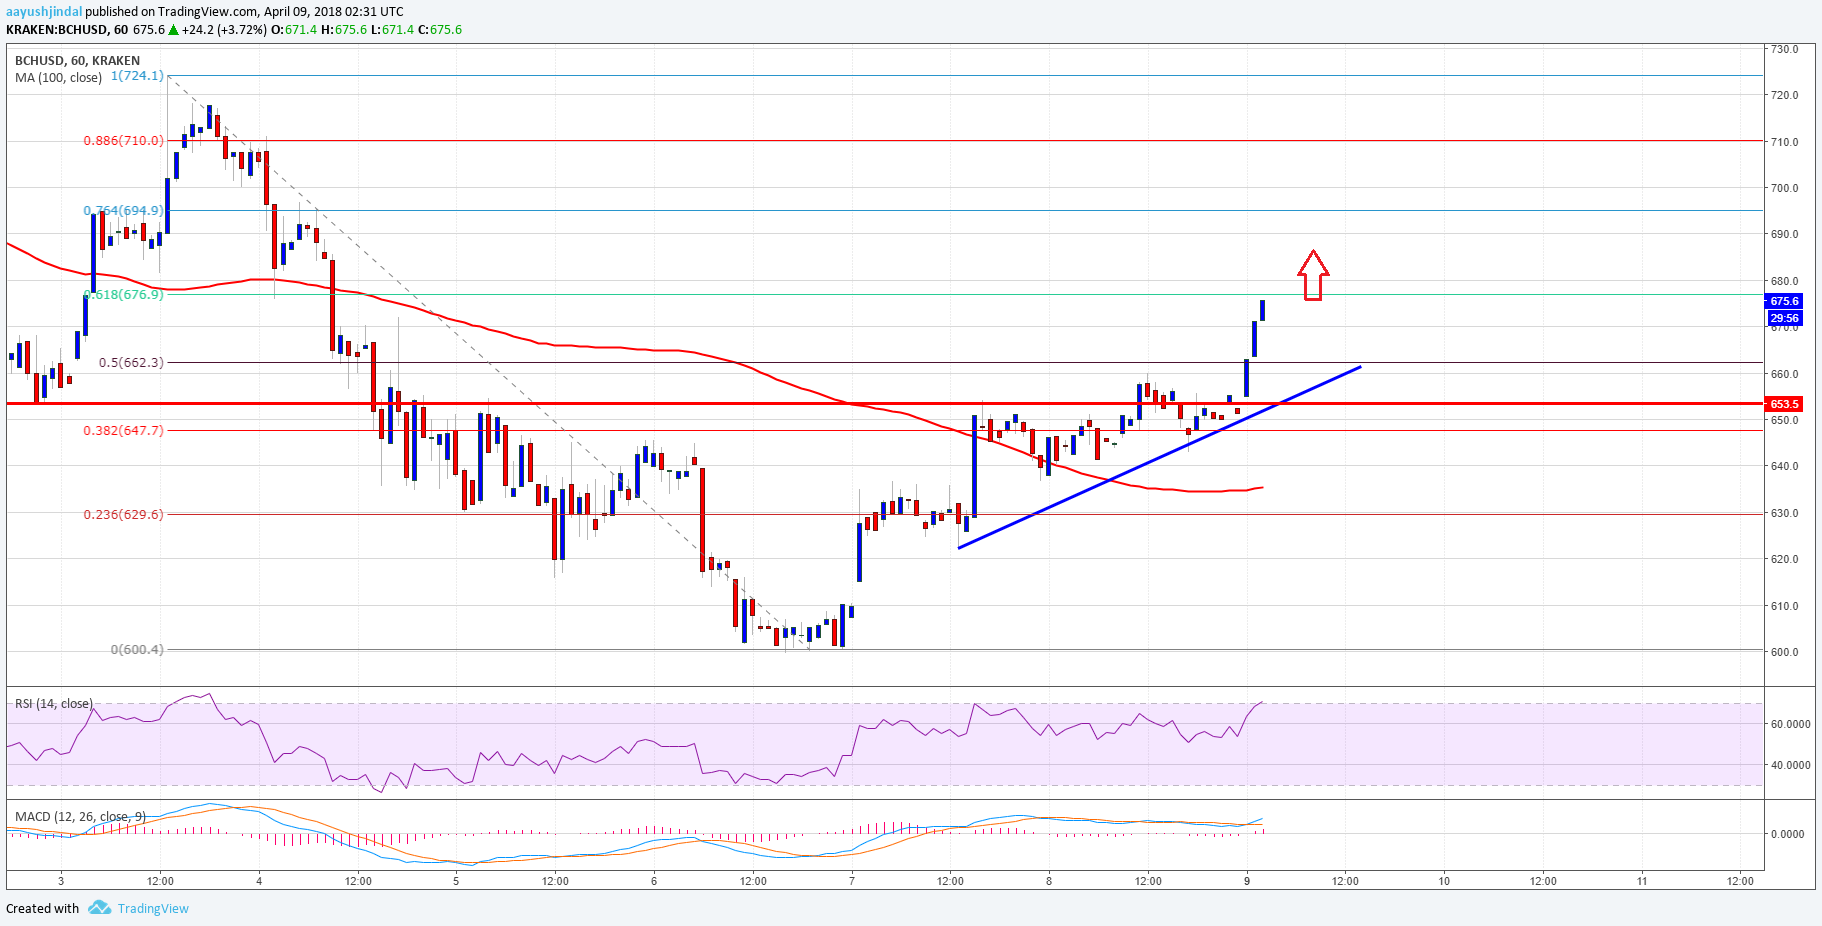

On the upside, the price has to break the 61.8% Fib retracement level of the last drop from the $724 high to $600 low. Above $680, the price may even break the $700 level for more gains in the near term.
Looking at the technical indicators:
Hourly MACD – The MACD for BCH/USD is moving in the bullish zone.
Hourly RSI (Relative Strength Index) – The RSI for BCH/USD is about to reach the overbought levels.
Major Support Level – $650
Major Resistance Level – $700
Charts courtesy – Trading View