
Key Points
- Bitcoin cash price is consolidating in a range above the $1500 support against the US Dollar.
- There is an ascending channel forming with support at $1600 on the hourly chart of BCH/USD (data feed from Kraken).
- The pair has to break the $1720 resistance level to gains upside momentum toward $2000.
Bitcoin cash price mostly traded in a range above $1500 against the US Dollar. BCH/USD has to move past $1720-1750 to move further higher in the near term.
Bitcoin Cash Price Support
There was no major upside move in bitcoin cash price above the $1650 level against the US Dollar. The price mostly traded in a tiny range with a slight bullish angle toward $1700. There was a low formed at $1500 from where the price moved higher. There was a slow and steady upside move above the $1600 level and the 100 hourly simple moving average.
Buyers push the price above the 23.6% Fib retracement level of the last major decline from the $2085 high to $1500 swing low. Moreover, there was a break above a major bearish trend line with resistance at $1650. It opened the doors for more gains toward $1700. At the moment, it seems like there is an ascending channel forming with support at $1600 on the hourly chart of BCH/USD. On the upside, the channel resistance is at $1720. It also coincides with the 38.2% Fib retracement level of the last major decline from the $2085 high to $1500 swing low.
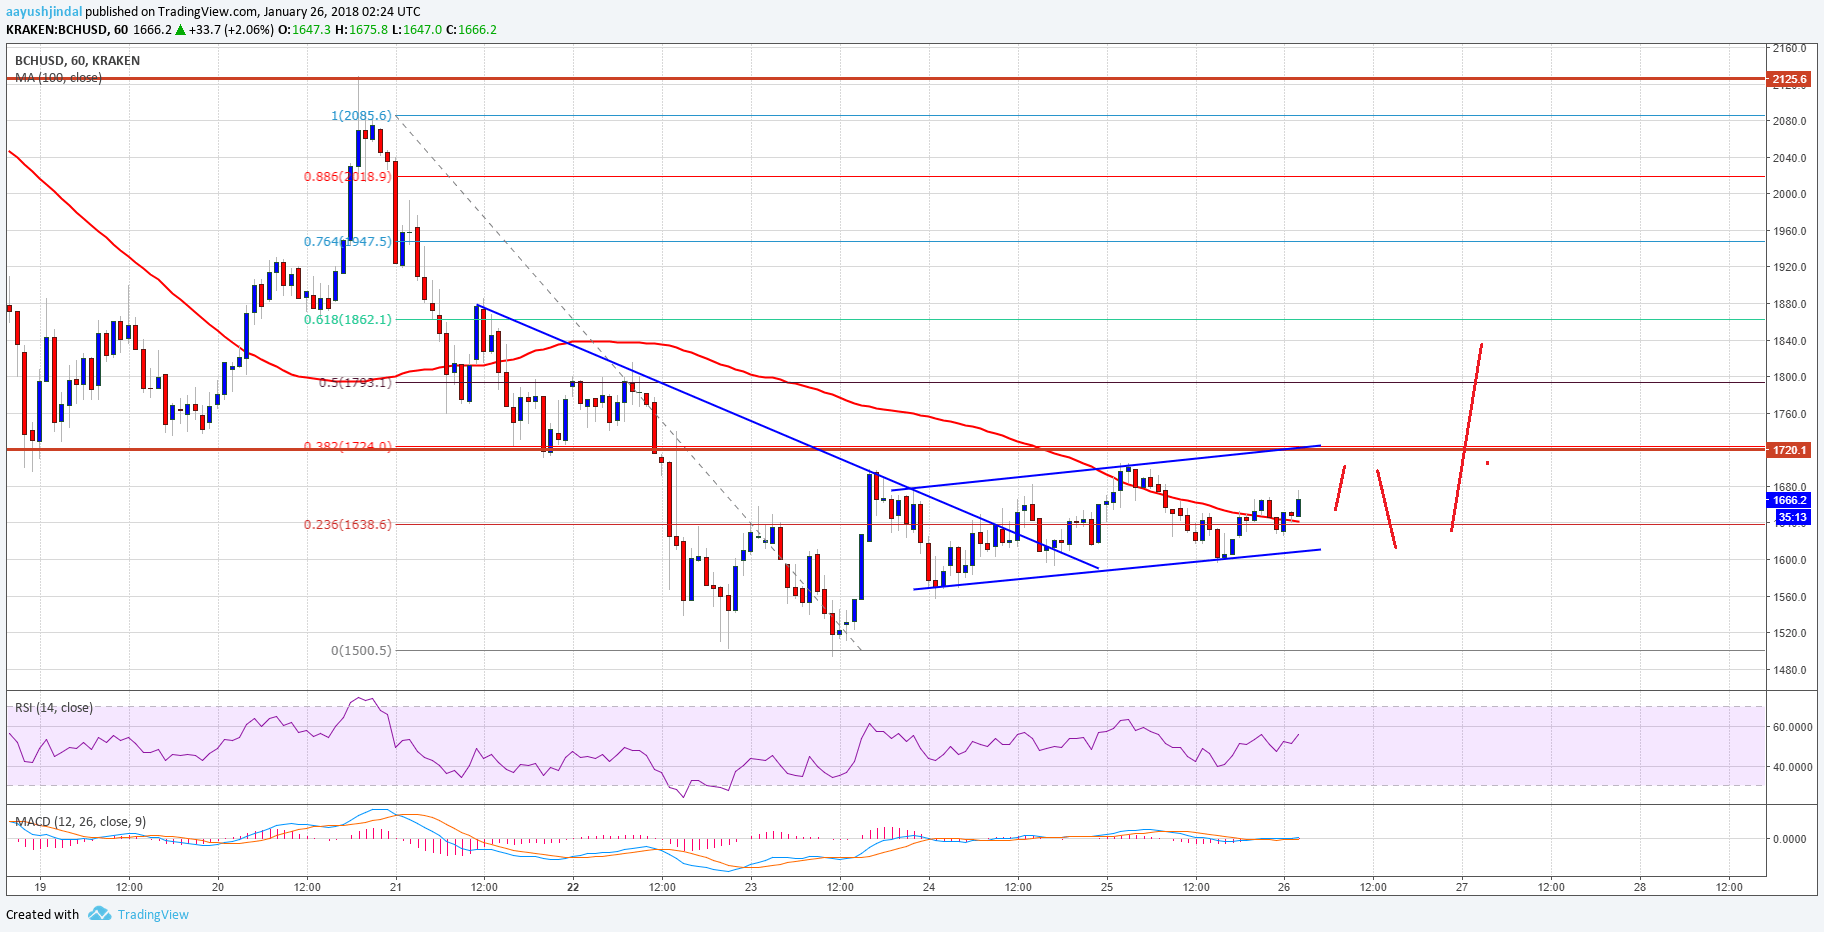

Therefore, a break and close above $1720 is needed for an upside push toward $1800. Above $1800, the price may head toward the $2000 resistance level.
Looking at the technical indicators:
Hourly MACD – The MACD for BCH/USD is positive, but there is no major bullish signal.
Hourly RSI (Relative Strength Index) – The RSI for BCH/USD is currently moving higher above the 50 level.
Major Support Level – $1600
Major Resistance Level – $1720
Charts courtesy – Trading View, Kraken