Key Points
- Bitcoin cash price is correcting lower from the swing high of $3307 against the US Dollar.
- There is a key bearish trend line forming with resistance at $2800 on the hourly chart of BCH/USD (data feed from Kraken).
- The pair is struggling to move above the $2800 level and it may correct a bit on the downside.
Bitcoin cash price is correcting lower from $3307 against the US Dollar. BCH/USD might correct further towards the $2600 level in the near term.
Bitcoin Cash Price Correction
After a major upside move, bitcoin cash price traded toward the $3000 level against the US Dollar. However, the price failed to gain momentum above the $3000 level and formed a high at $3307. Later, a downside correction wave was initiated and the price moved below the 23.6% Fib retracement level of the last wave from the $1760 low to $3307 high. It seems like the current wave is a part of correction, but the price has to stay above $2500.
It has already tested the 50% Fib retracement level of the last wave from the $1760 low to $3307 high. The price is currently recoverin, but it is struggling to gain momentum above $2800 and the 100 hourly simple moving average. Moreover, there is also a key bearish trend line forming with resistance at $2800 on the hourly chart of BCH/USD. The trend line resistance at $2800 is acting as a major barrier for buyers. A close above the $2800 level is needed for buyers to gain traction.
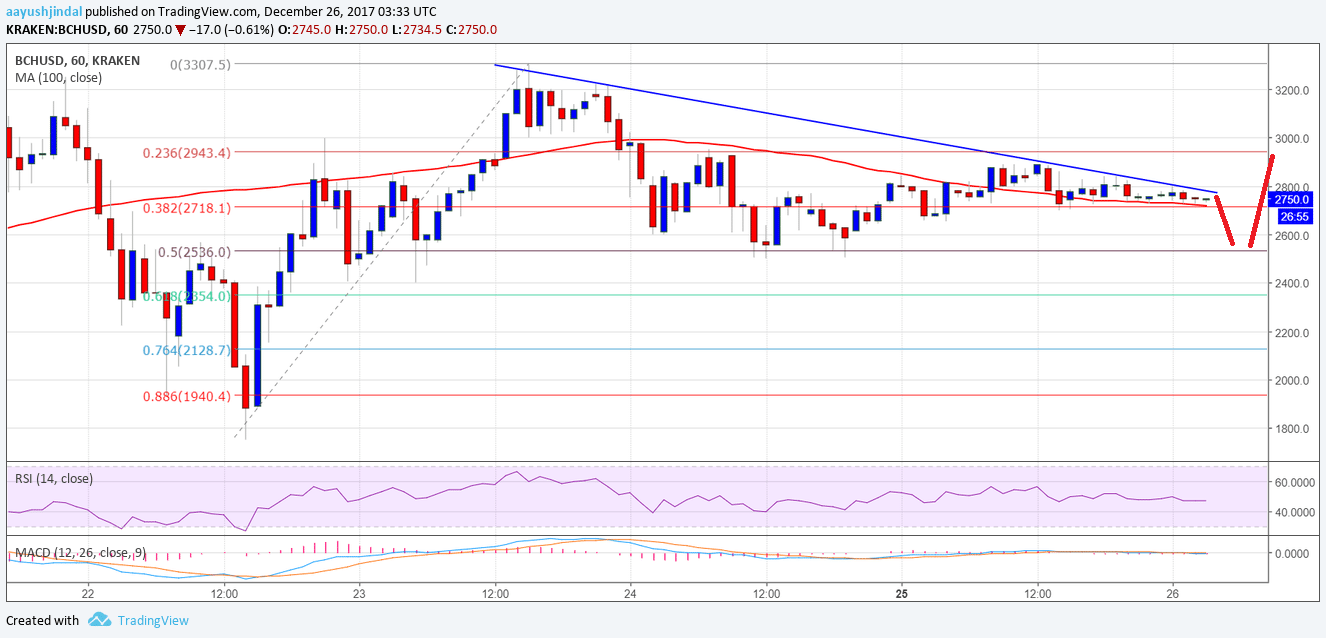
On the downside, the 100 hourly SMA is a short-term support around $2700. The pair remains supported above the $2500 level. A break below $2500 would negate the current bullish bias.
Looking at the technical indicators:
Hourly MACD – The MACD for BCH/USD is mostly flat in the bearish zone.
Hourly RSI (Relative Strength Index) – The RSI for BCH/USD is currently just above the 50 level.
Major Support Level – $2500
Major Resistance Level – $2800
Charts courtesy – Trading View, Kraken