

Key Points
- Bitcoin cash price came under a lot of pressure and traded below the $1500 support against the US Dollar.
- There is a new bearish trend line forming with current resistance at $1580 on the hourly chart of BCH/USD (data feed from SimpleFX).
- The pair is currently correcting higher, but it is likely to face sellers near $1480 and $1500.
Bitcoin cash price declined sharply below $1500 against the US Dollar. BCH/USD is under a lot of pressure and it could even break the $1400 support.
Bitcoin Cash Price Decline
There was no recovery in bitcoin cash price as it failed to move above the $1650 level against the US Dollar. The price declined sharply and broke a few important support levels such as $1550 and $1500. It traded close to the $1400 level and formed a low at $1392. At the moment, the price is correcting higher and is testing the 23.6% Fib retracement level of the last decline from the $1638 high to $1392 low.
On the upside, the broken support at $1475 is likely to act as a resistance in the near term. It could act as a major hurdle for buyers and prevent upsides above $1500. Above $1500, the 50% Fib retracement level of the last decline from the $1638 high to $1392 low may act as a resistance. There is also a new bearish trend line forming with current resistance at $1580 on the hourly chart of BCH/USD.
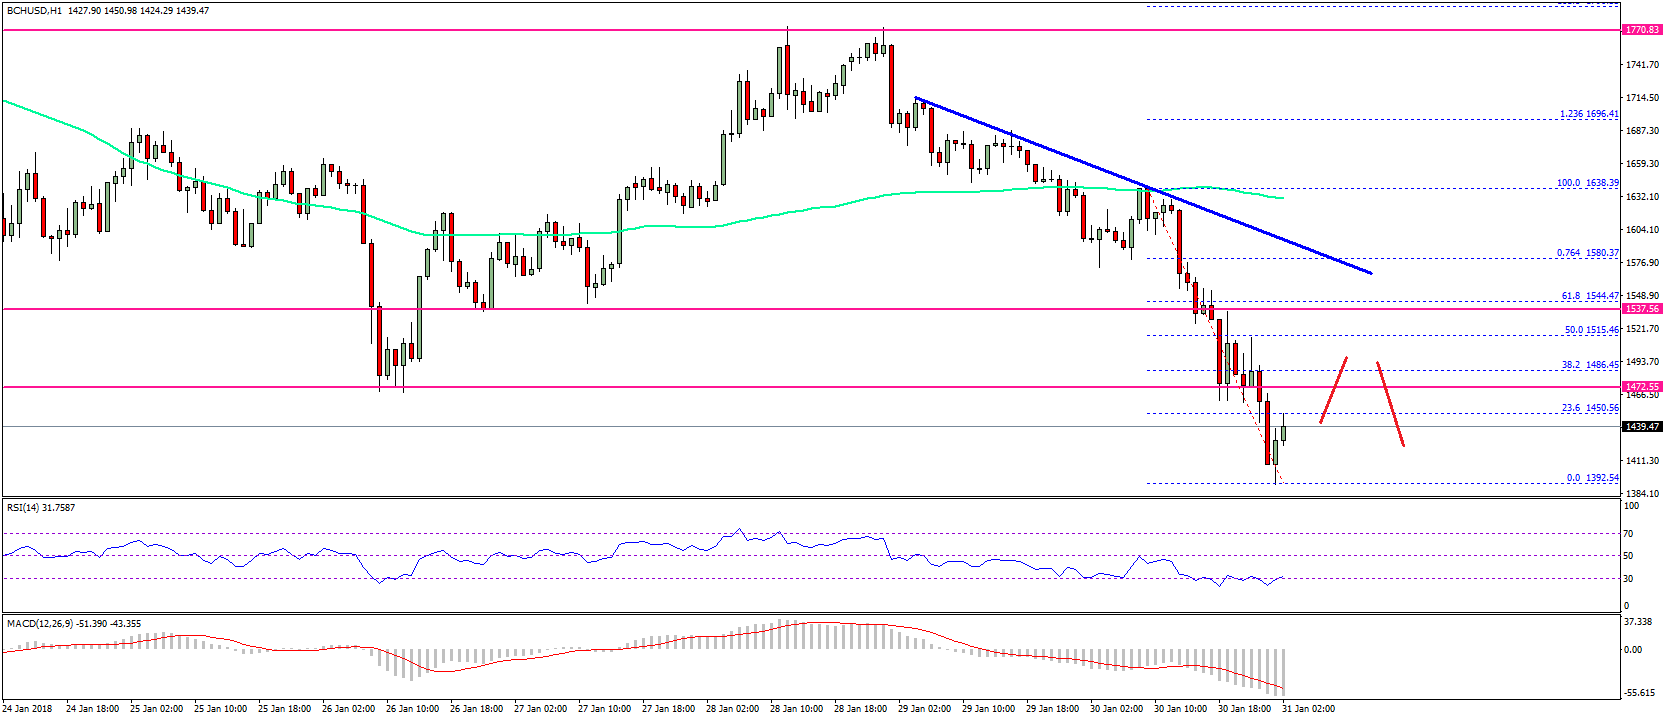

The trend line resistance at $1580 is above the 61.8% Fib retracement level of the last decline from the $1638 high to $1392 low. Therefore, any major recoveries from the current levels is likely to be capped.
Looking at the technical indicators:
Hourly MACD – The MACD for BCH/USD is extending moves in the bearish zone.
Hourly RSI (Relative Strength Index) – The RSI for BCH/USD is now near the extreme oversold levels.
Major Support Level – $1400
Major Resistance Level – $1500
Charts courtesy – SimpleFX