

Key Points
- Bitcoin cash price remains in a bearish zone and is currently trading below $880 against the US Dollar.
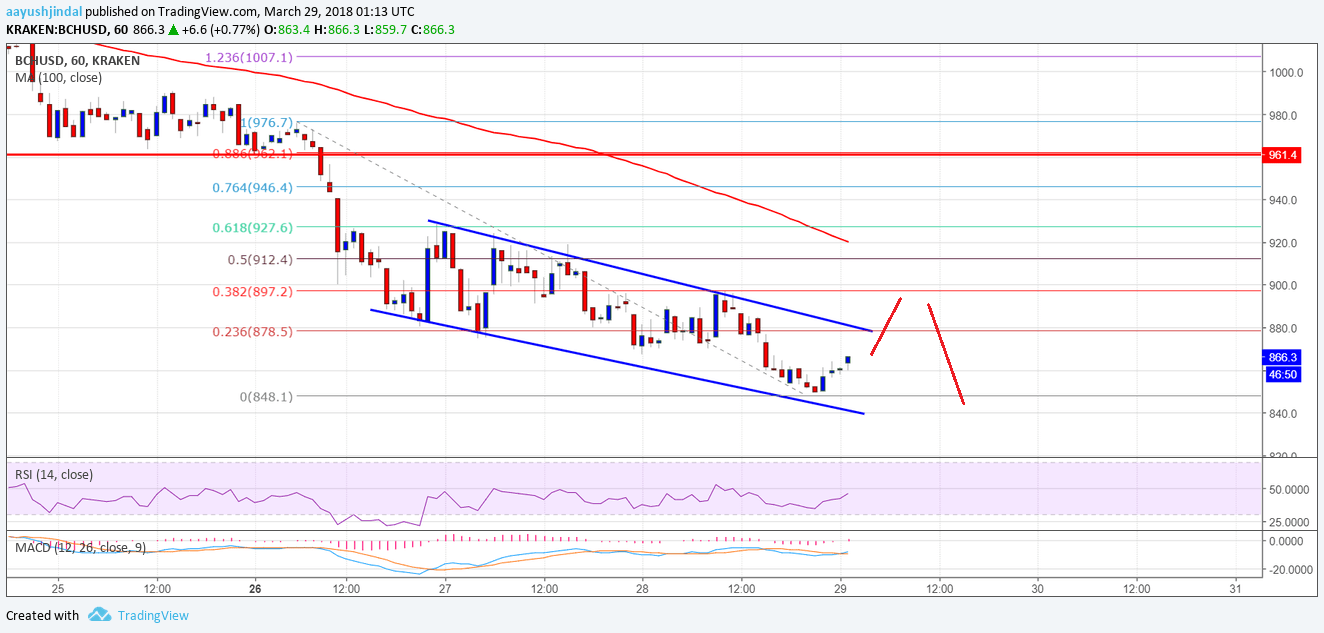
- There is a major declining channel forming with resistance near $880 on the hourly chart of the BCH/USD pair (data feed from Kraken).
- The pair may correct a few points in the near term, but upsides could be capped by $880 and $900.
Bitcoin cash price is struggling to move higher against the US Dollar. BCH/USD is now well below the $900 and $950 pivot levels.
Bitcoin Cash Price Trend
There is a solid bearish trend in place in bitcoin cash price since it broke the $900 level against the US Dollar. The price also broke the $880 support level recently and even pierced the $850 level. A new low was formed at $848 before the price found buyers. A minor correction is underway and the price moved above the $850 level. It is now approaching the 23.6% Fib retracement level of the last drop from the $976 high to $848 low.
However, there are many hurdles on the upsides around the $900 level. There is also a major declining channel forming with resistance near $880 on the hourly chart of the BCH/USD pair. The channel resistance is a crucial barrier for the current wave around $880. A break above the $880 level could push the price towards the next hurdle at $900. The next main resistance is the 50% Fib retracement level of the last drop from the $976 high to $848 low.

If the price fails to move above the $880 level, there could be a downside reaction. In this case, the price may even break the last low of $848 for more losses.
Looking at the technical indicators:
Hourly MACD – The MACD for BCH/USD is still placed in the bearish zone.
Hourly RSI (Relative Strength Index) – The RSI for BCH/USD is moving higher towards the 50 level.
Major Support Level – $850
Major Resistance Level – $900
Charts courtesy – Trading View