Key Points
- Bitcoin cash price continued to trade down and it moved below the $1,200 support against the US Dollar.
- There was a break below a major bullish trend line with support at $1,228 on the hourly chart of BCH/USD (data feed from SimpleFX).
- The pair is currently correcting higher, but it could face sellers on the upside near $1,200-10.
Bitcoin cash price is showing bearish signs below $1,220 against the US Dollar. BCH/USD is likely to remains in a bearish zone as long as below $1,250.
Bitcoin Cash Price Resistance
There was a minor recovery yesterday above $1,240 in bitcoin cash price against the US Dollar. However, the price could not retain the momentum and moved down below $1,220. The downside move was substantial since there was a break below the $1,200 support level. The price is now trading well below the $1,240 pivot and the 100 hourly simple moving average.
During the downside move, there was a break below a major bullish trend line with support at $1,228 on the hourly chart of BCH/USD. The pair even broke the $1,180 support and traded as low as $1,159. At the moment, the pair is correcting higher above $1,180. It moved above the 23.6% Fib retracement level of the last drop from the $1,272 high to $1,159 low. However, there are many resistances on the upside near $1,200 and $1,225. An intermediate resistance is around $1,215 and the 50% Fib retracement level of the last drop from the $1,272 high to $1,159 low.
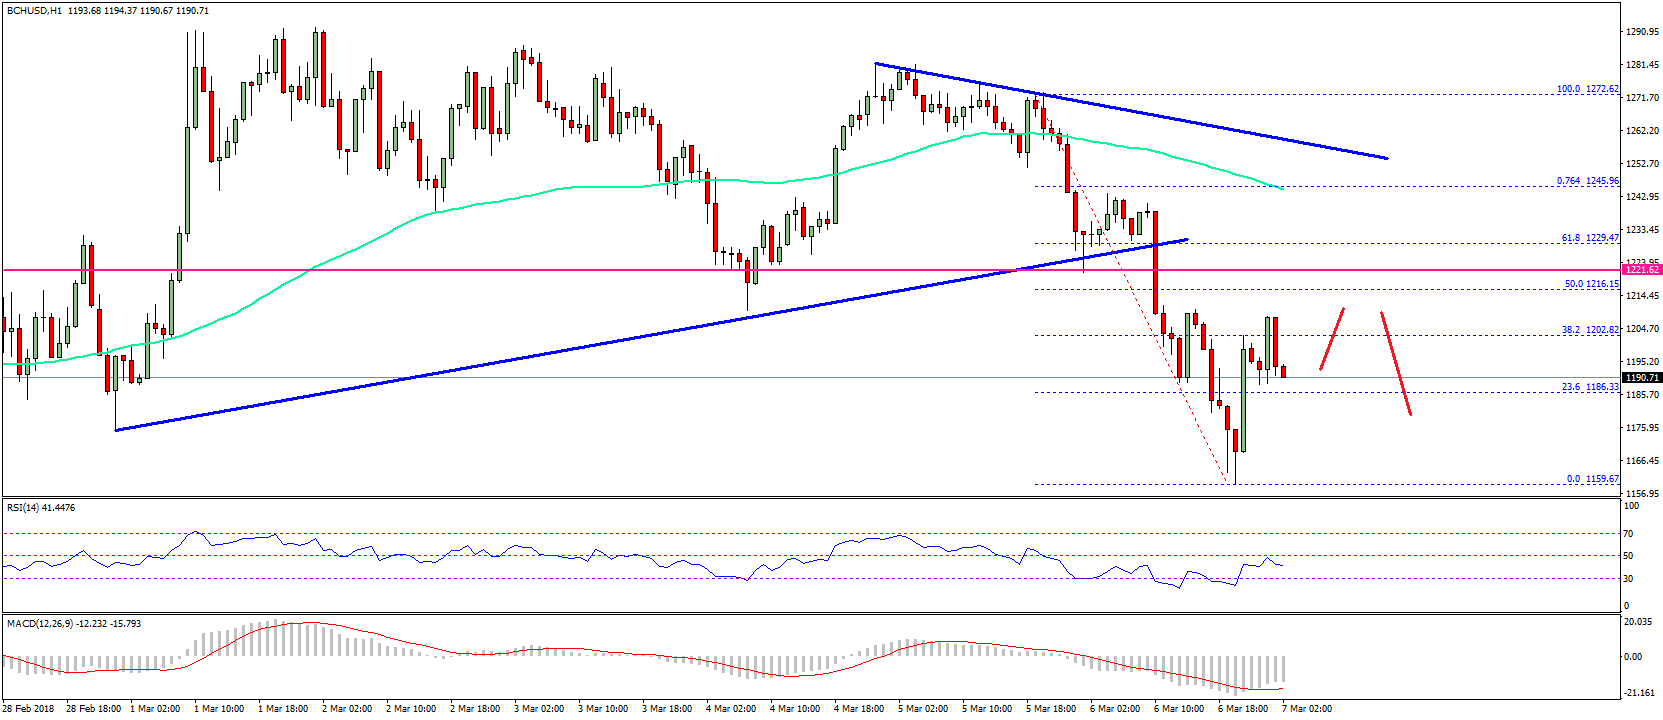

Therefore, any major upside move could face a strong selling interest near $1,220. On the downside, the $1,160 level is a decent support. A break below $1,160 may push the price towards $1,120.
Looking at the technical indicators:
Hourly MACD – The MACD for BCH/USD is placed strongly in the bearish zone.
Hourly RSI (Relative Strength Index) – The RSI for BCH/USD is struggling to recover and is currently below 50.
Major Support Level – $1,160
Major Resistance Level – $1,220
Charts courtesy – SimpleFX