Key Points
- Bitcoin cash price is trading in a bearish zone above the $960 support against the US Dollar.
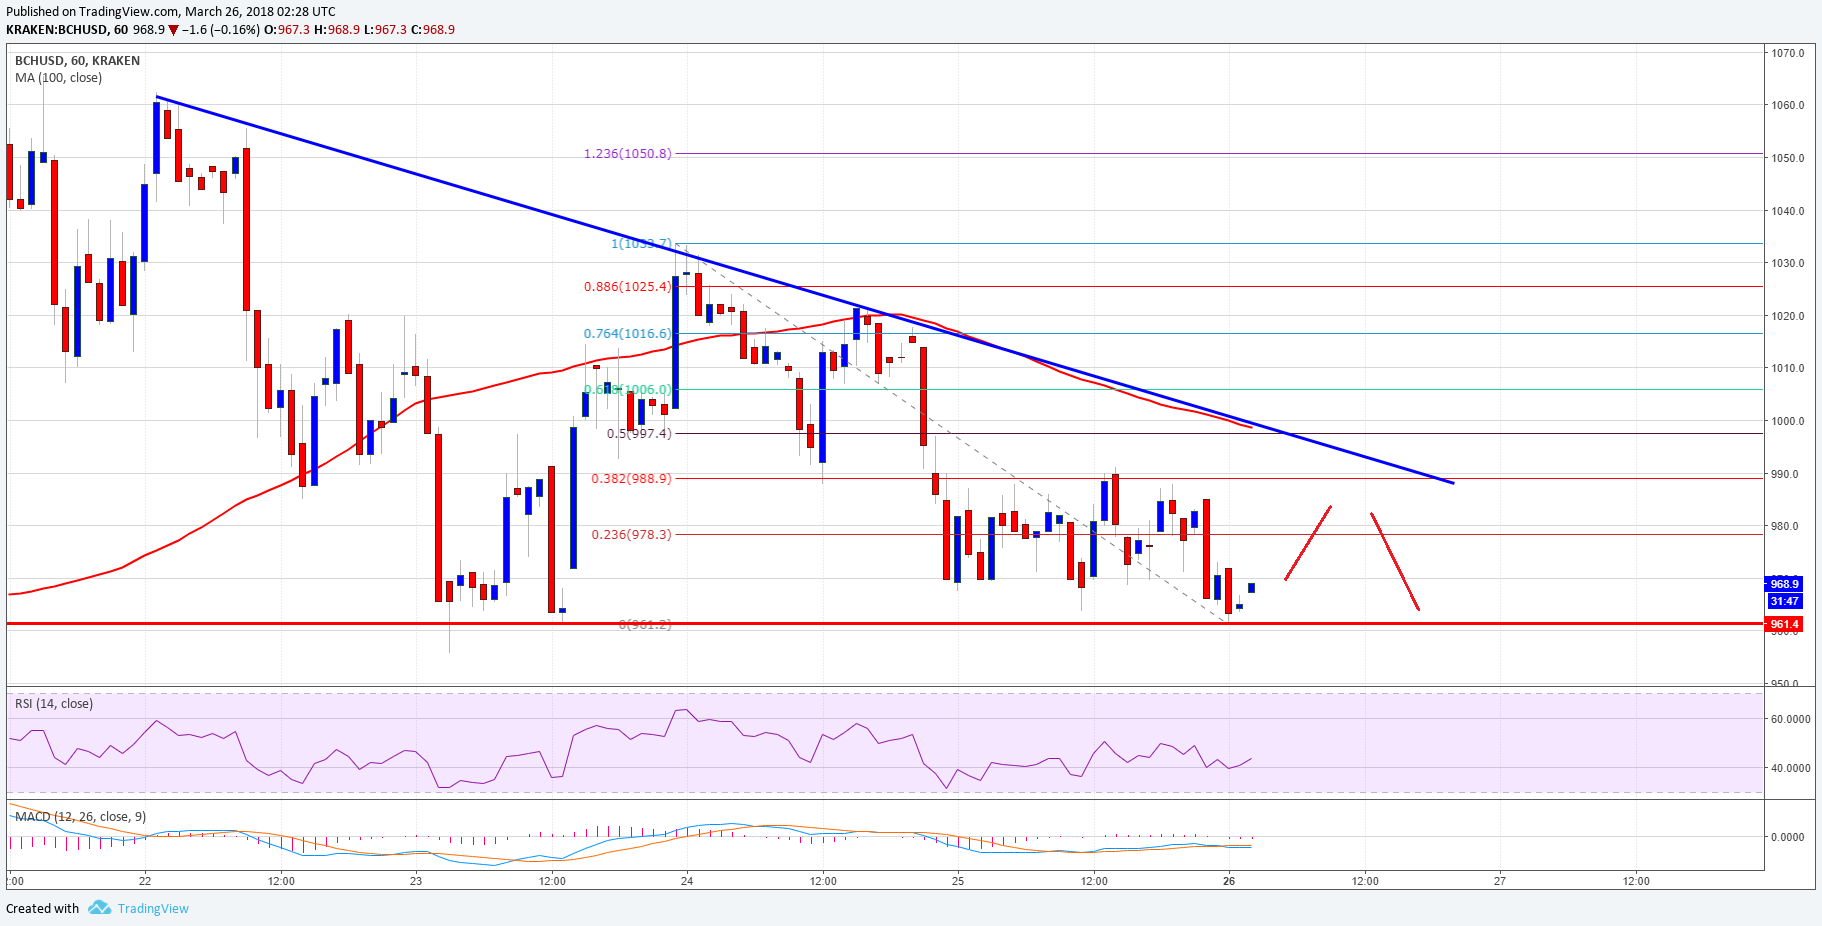
- There is a major bearish trend line forming with resistance near $990 on the hourly chart of the BCH/USD pair (data feed from Kraken).
- The pair remains at a risk of more losses if it fails to hold the $950-960 support area.
Bitcoin cash price is slowly moving lower against the US Dollar. BCH/USD must stay above the $950-960 support area to avoid further declines.
Bitcoin Cash Price Resistance
There was no major relief as bitcoin cash price traded below the $1,040 support level against the US Dollar. The price struggled to move higher and the upside was capped by the $1,080 resistance. There was also a close below the $1,000 level and the 100 hourly simple moving average. However, the price is currently holding a major support area at $950-90.
The current price action is bearish as long as the price is below the $1,000 level and the 100 hourly simple moving average. An initial resistance is around the 23.6% Fib retracement level of the last decline from the $1,039 high to $961 low. There is also a major bearish trend line forming with resistance near $990 on the hourly chart of the BCH/USD pair. The trend line resistance is close to the 50% Fib retracement level of the last decline from the $1,039 high to $961 low. Therefore, if the price corrects higher, it won’t be easy for buyers to break the $990 and $1,000 resistances.

On the downside, the $950 and $960 support levels are very important. A close below the stated levels could ignite a push towards $900 in the near term.
Looking at the technical indicators:
Hourly MACD – The MACD for BCH/USD is currently flat in the bearish zone.
Hourly RSI (Relative Strength Index) – The RSI for BCH/USD is moving higher towards the 50 level.
Major Support Level – $950
Major Resistance Level – $1,000
Charts courtesy – Trading View