
Key Points
- Bitcoin cash price succeeded in moving above a major resistance at $2500 against the US Dollar.
- There was a break above a key contracting triangle with resistance at $2500 on the hourly chart of BCH/USD (data feed from Kraken).
- The pair is currently correcting lower and is testing the same broken resistance at $2500.
Bitcoin cash price is gaining momentum above $2500 against the US Dollar. BCH/USD might continue to move higher after a minor correction from $2740.
Bitcoin Cash Price Support
There was a steady rise initiated in bitcoin cash price from the $2180 swing low against the US Dollar. The price was able to move above the $2200 and $2300 resistance levels. There was even a break above the 50% Fib retracement level of the last drop from the $2900 high to $2147 low. Therefore, it seems like the price is forming a steady bullish bias above the $2200 level.
There was also a break above a key contracting triangle with resistance at $2500 on the hourly chart of BCH/USD. It opened the doors for more gains above $2500. The pair traded above the $2700 level and formed a high at $2738. Later, a downside correction was initiated and the price moved below the $2700 level. It is currently trading near the 38.2% Fib retracement level of the last wave from the $2210 low to $2738 high. Moreover, the same broken resistance at $2500 is now acting as a support.
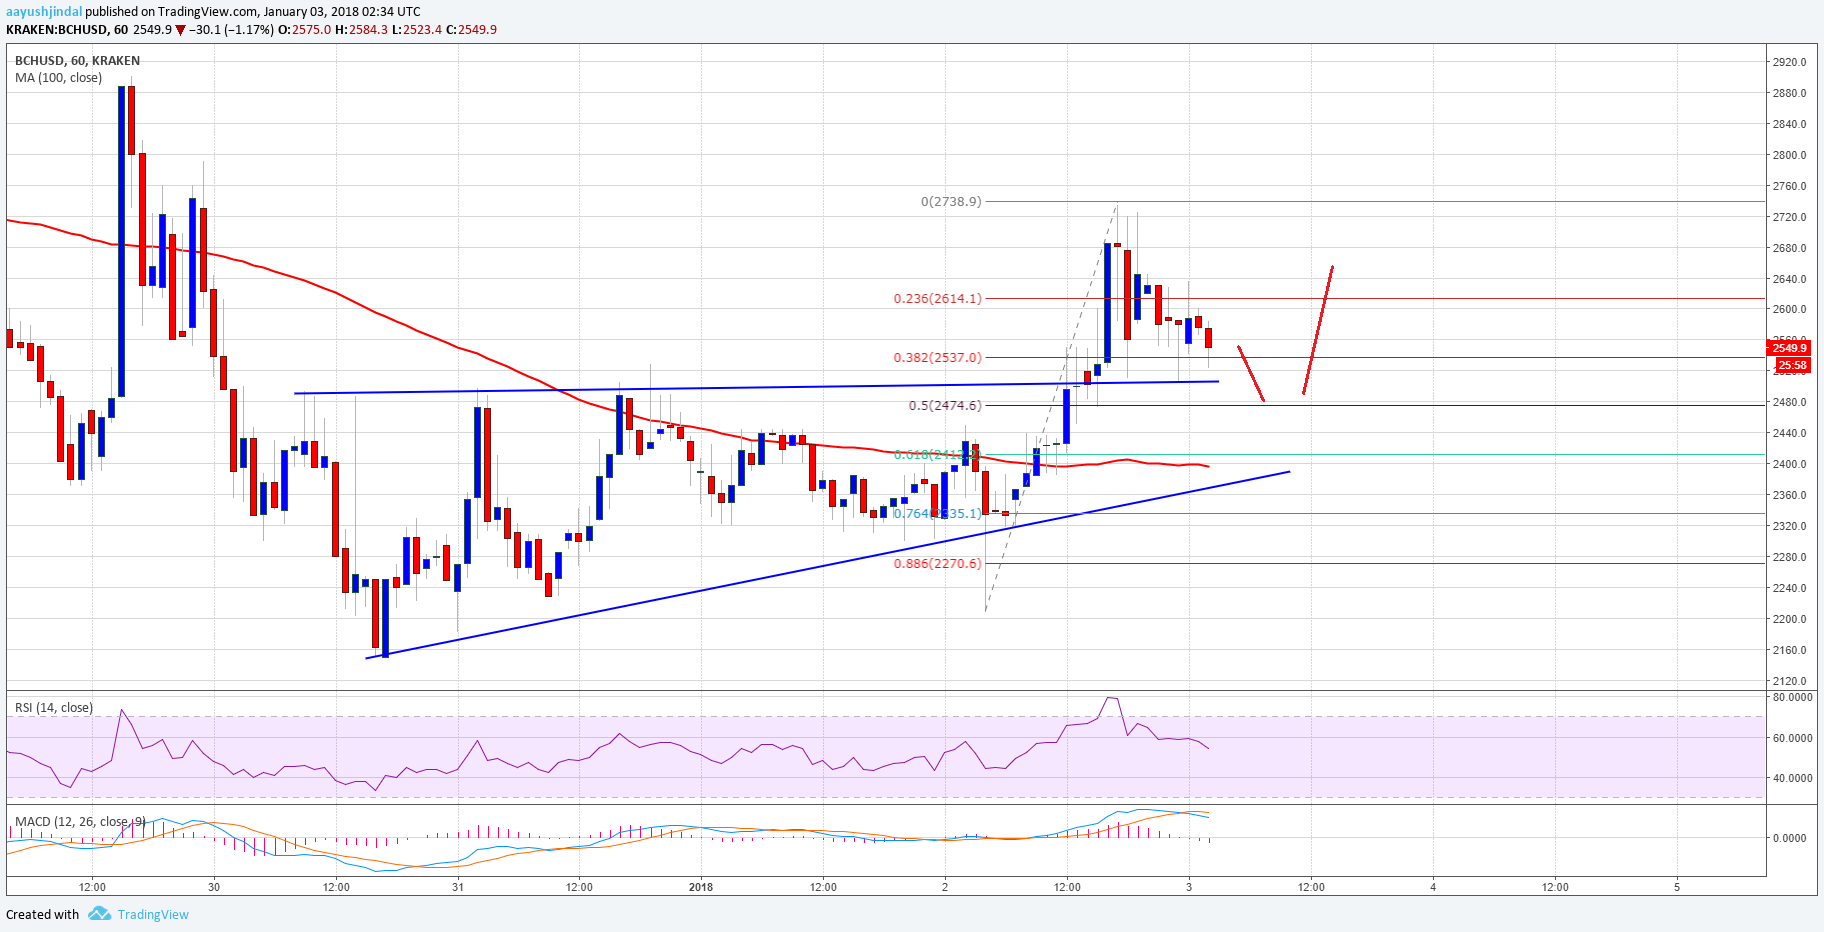

Overall, the price remains in a bullish trend above $2500 and it will most likely continue higher. On the downside, the next major support is around the $2475 level. It is near the 50% Fib retracement level of the last wave from the $2210 low to $2738 high.
Looking at the technical indicators:
Hourly MACD – The MACD for BCH/USD is slowly moving into the bullish zone.
Hourly RSI (Relative Strength Index) – The RSI for BCH/USD is moving lower towards the 50 level.
Major Support Level – $2475
Major Resistance Level – $2700
Charts courtesy – Trading View, Kraken