
Key Points
- Bitcoin cash price declined as low as $748 and is currently recovering against the US Dollar.
- There was a break above a bearish trend line with resistance at $890 on the hourly chart of BCH/USD (data feed from SimpleFX).
- There is another bearish trend line on the upside with resistance at $1060 on the same chart.
Bitcoin cash price recovered nicely from the $748 low against the US Dollar. BCH/USD is currently above $900 and is facing resistances near $1,000 and $1,060.
Bitcoin Cash Price Recovery
There were further declines in bitcoin cash price below the $900 level against the US Dollar. The price even broke the $800 level and traded as low as $748. Later, the price started an upside correction and moved above the $800 level. It was able to move above the 23.6% Fib retracement level of the decline from the $1,160 high to $748 low as well.
More importantly, there was a break above a bearish trend line with resistance at $890 on the hourly chart of BCH/USD. The pair traded above the $900 level and made a decent recovery. However, there is another bearish trend line on the upside with resistance at $1060 on the same chart. Moreover, the price is currently testing the 50% Fib retracement level of the decline from the $1,160 high to $748 low. It is struggling to gain momentum above $950-960. It could move towards the $1,000 level, but an upside break above $1,000 won’t be easy.
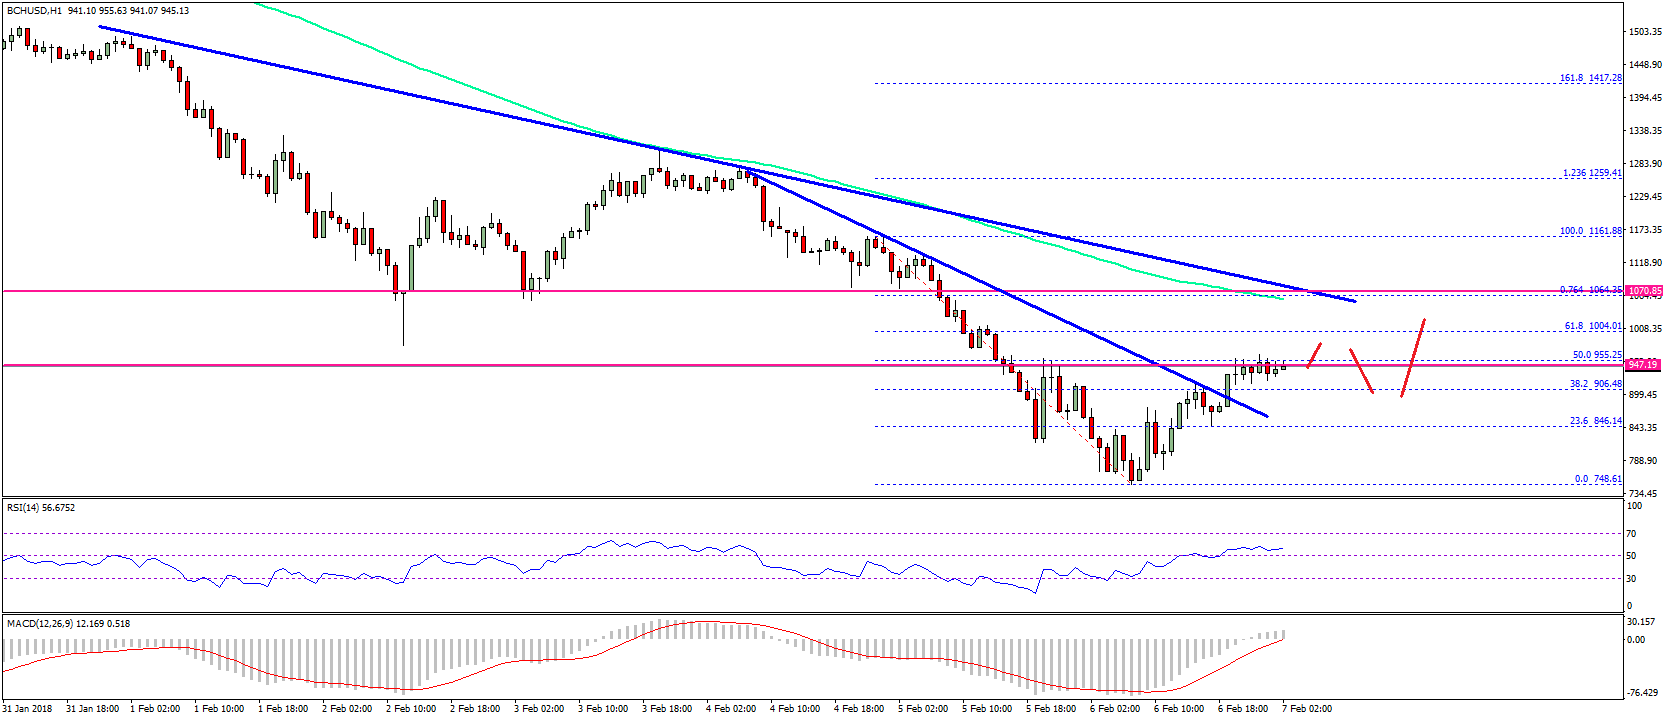

On the downside, the broken resistance at $900 is a support. Below $900, the price may retest the $800 support level if sellers come back in the action.
Looking at the technical indicators:
Hourly MACD – The MACD for BCH/USD has just moved from the bearish to the bullish zone.
Hourly RSI (Relative Strength Index) – The RSI for BCH/USD has just managed to move back above the 50 level.
Major Support Level – $900
Major Resistance Level – $1,000
Charts courtesy – SimpleFX