

Key Points
- Bitcoin cash price traded lower sharply and broke the $900 support level against the US Dollar.
- There is a key connecting bearish trend line forming with resistance at $910 on the hourly chart of the BCH/USD pair (data feed from Kraken).
- The pair may continue to move down and it could soon test the $850 level in the near term.
Bitcoin cash price is in a bearish trend below $950 against the US Dollar. BCH/USD is likely to extend declines in the short term towards $850 and $800.
Bitcoin Cash Price Resistance
There were continuous declines in bitcoin cash price from the $960 swing high against the US Dollar. The price broke the $950 and $900 support levels to set the pace for more losses. More importantly, the price settled below the $900 level and is currently well below the 100 hourly simple moving average. It recently traded as low as $867 and it may correct a few points in the short term.
An initial resistance is near the 23.6% Fib retracement level of the last decline from the $990 swing high to $867 low. Moreover, there is a key connecting bearish trend line forming with resistance at $910 on the hourly chart of the BCH/USD pair. The same resistance area is positioned around the 38.2% Fib retracement level of the last decline from the $990 swing high to $867 low. Therefore, the price may continue to face sellers if it moves higher from the current levels towards $900 and $910.
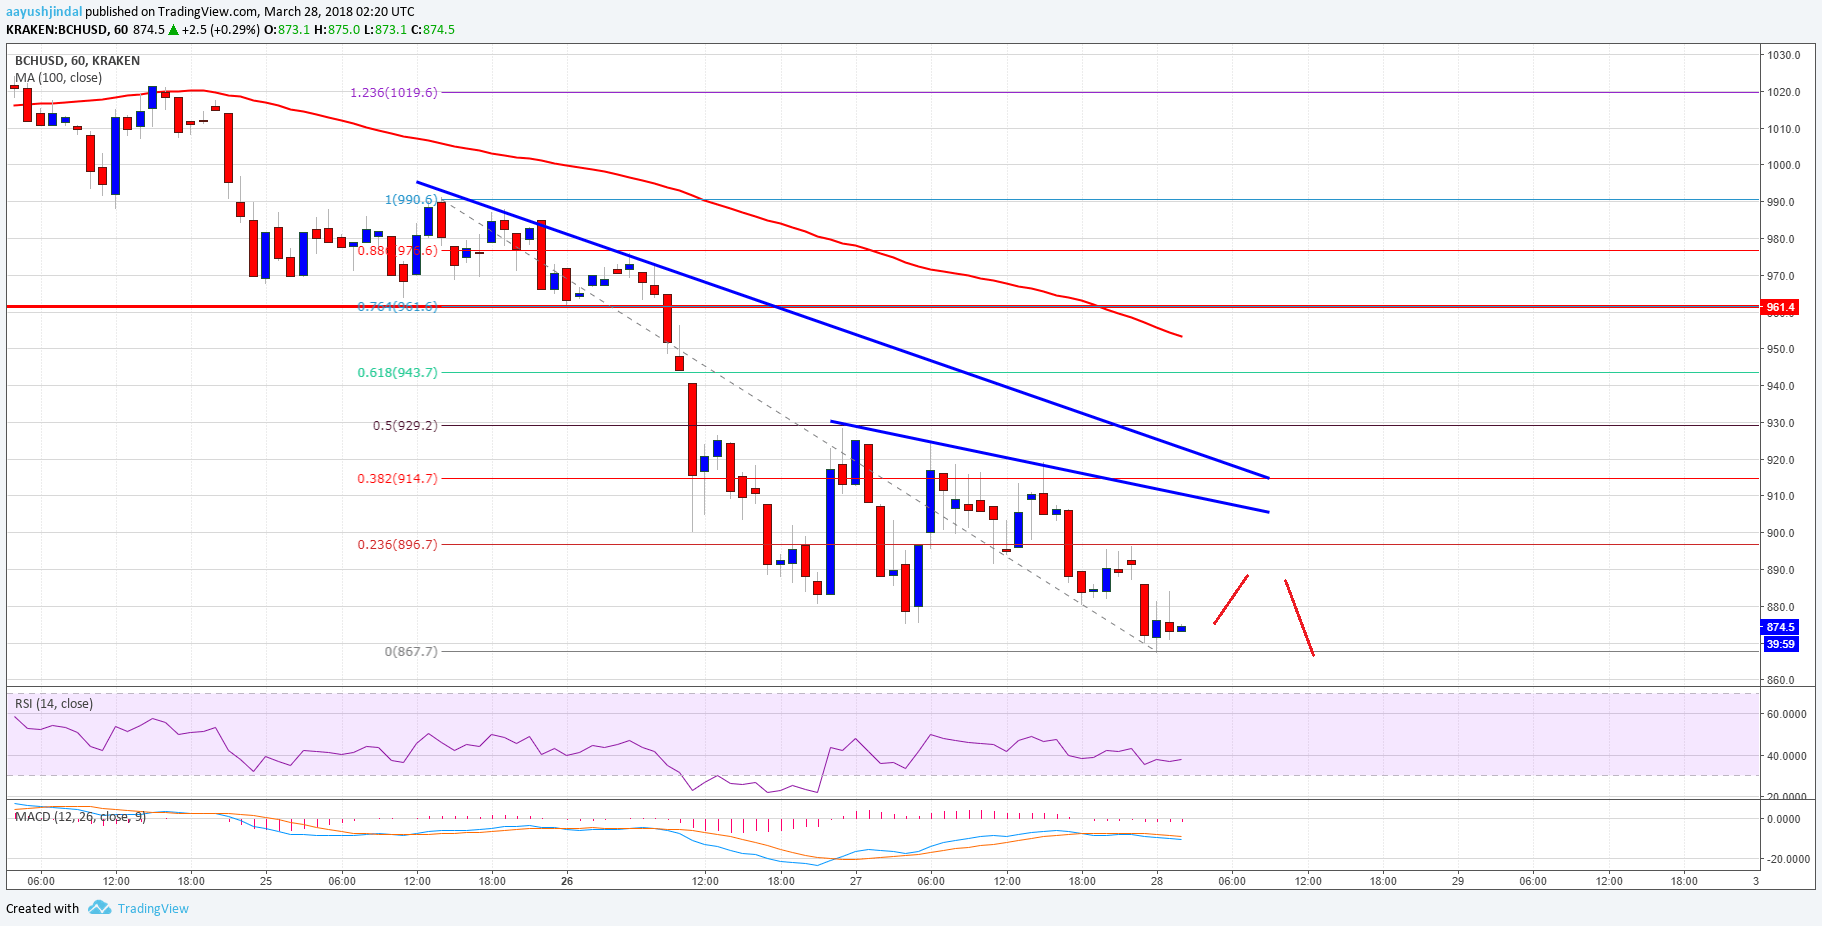

On the downside, the recent low at $867 may not hold for long. A break below $867 will most likely call for a push towards the $850 level in the near term.
Looking at the technical indicators:
Hourly MACD – The MACD for BCH/USD is gaining pace in the bearish zone.
Hourly RSI (Relative Strength Index) – The RSI for BCH/USD is now positioned well below the 40 level.
Major Support Level – $850
Major Resistance Level – $910
Charts courtesy – Trading View