

Key Points
- Bitcoin cash price started consolidating gains above the $1,420 level against the US Dollar.
- There is a major bullish trend line forming with support at $1,440 on the hourly chart of the BCH/USD pair (data feed from Kraken).
- The pair may correct a few points in the near term, but it remains supported above $1,420.
Bitcoin cash price is placed nicely in a bullish zone against the US Dollar. BCH/USD may perhaps resume its upside once the current correction is over.
Bitcoin Cash Price Consolidation
After a major upside move above the $1,500 level, bitcoin cash price faced sellers against the US Dollar. The price traded as high as $1,538 before starting a downside correction. It declined and moved below the $1,500 support to start a short-term correction. It is currently testing the 23.6% Fib retracement level of the last wave from the $1,240 low to $1,538 high.
However, there are many supports on the downside on the way up to $1,400. First, there is a major bullish trend line forming with support at $1,440 on the hourly chart of the BCH/USD pair. Second, the 38.2% Fib retracement level of the last wave from the $1,240 low to $1,538 high. Third, the 100 hourly simple moving average near the $1,400 level. Finally, the 50% Fib retracement level of the last wave from the $1,240 low to $1,538 high at $1,389. Having said that, there are very less chances that the pair may correct below $1,400 in the short term.
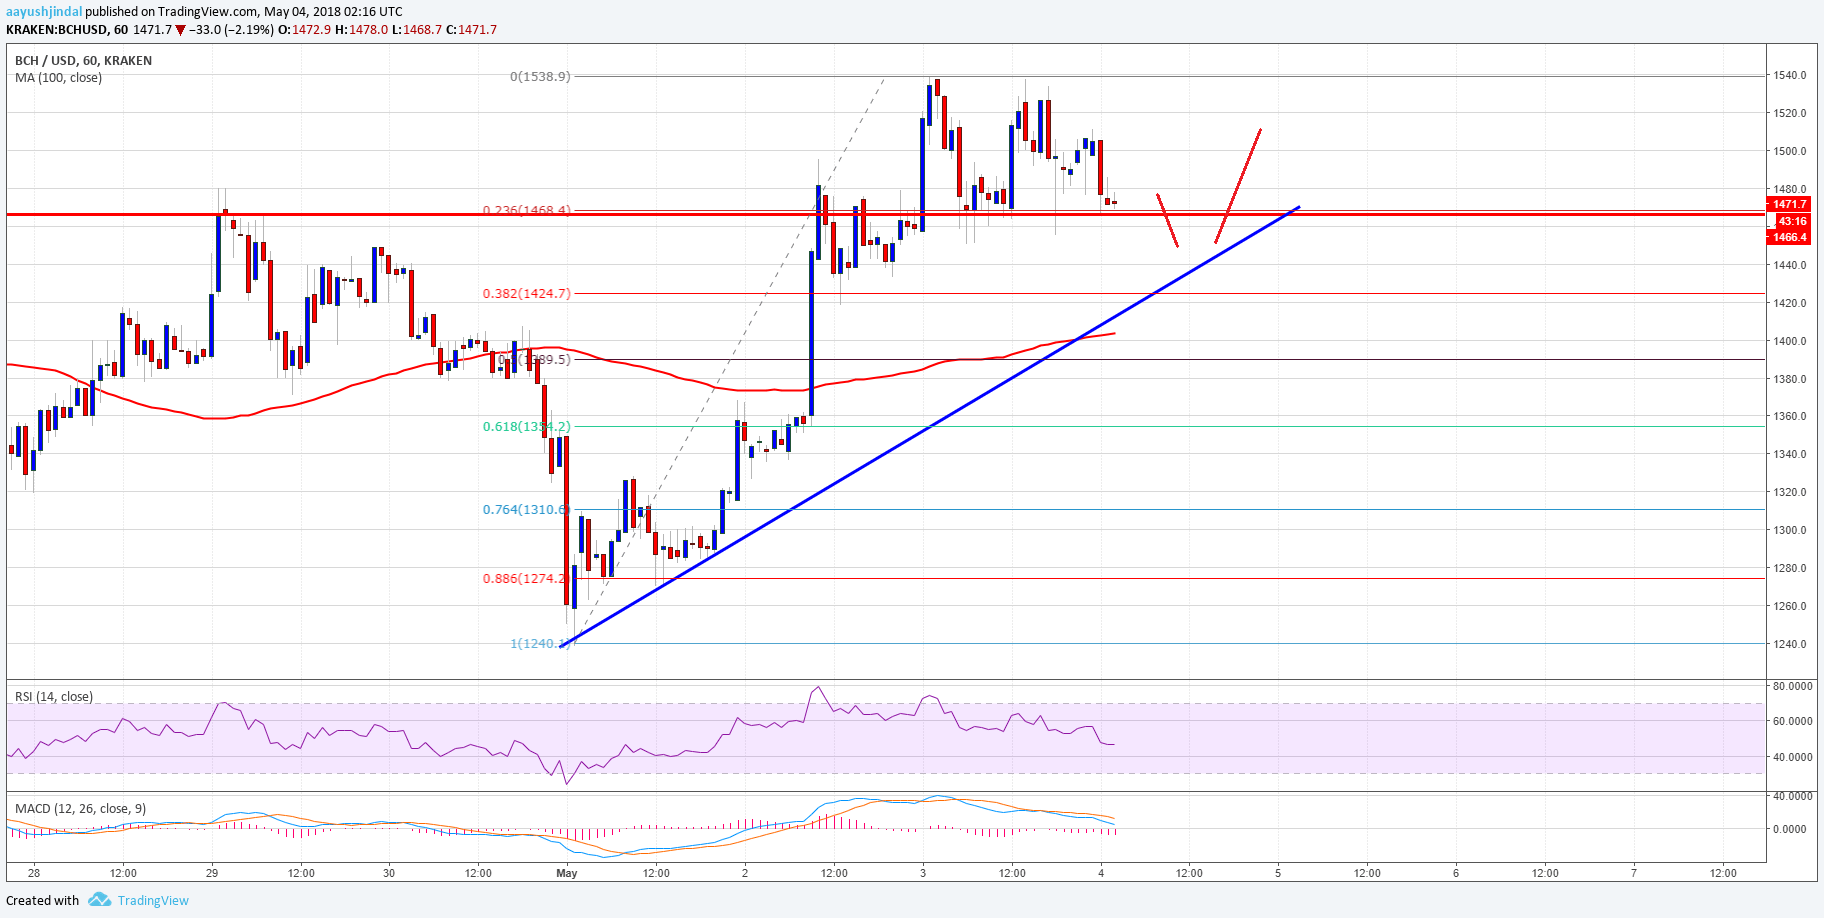

Looking at the chart, the price remains supported above the $1,420 level. On the upside, the $1,500 level is an initial resistance, followed by the $1,540 level. A break above the stated $1,540 level might open the doors for more gains towards $1,600.
Looking at the technical indicators:
Hourly MACD – The MACD for BCH/USD is slowly moving in the bearish zone.
Hourly RSI (Relative Strength Index) – The RSI for BCH/USD has moved below the 50 level.
Major Support Level – $1,420
Major Resistance Level – $1,500