Key Points
- Bitcoin cash price is moving lower from the $2960 swing high against the US Dollar.
- There was a break below a major bullish trend line with support at $2840 on the hourly chart of BCH/USD (data feed from Kraken).
- The pair might continue to decline and it will most likely retest the $2500 support area.
Bitcoin cash price is trading lower from $3000 against the US Dollar. BCH/USD might decline further towards the $2500 and $2400 support levels.
Bitcoin Cash Price Resistance
There was a decent upside move in bitcoin cash price above the $2600 level against the US Dollar. The price traded towards the $3000 level, but there was no test of the stated level. A high was formed near $2960 and the price started a downside correction. It traded below the $2800 support. There was also a break below a major bullish trend line with support at $2840 on the hourly chart of BCH/USD.
The pair traded below the $2600 support and formed a low at $2543. Later, an upside wave was initiated and the price moved above the $2600 level. It also moved above the 23.6% Fib retracement level of the last decline from the $2960 high to $2543 low. However, the upside wave was protected by the $2750 resistance level. Moreover, the 38.2% Fib retracement level of the last decline from the $2960 high to $2543 low also acted as a resistance. On the upside, there is also a bearish trend line on the same chart with current resistance at $2750.
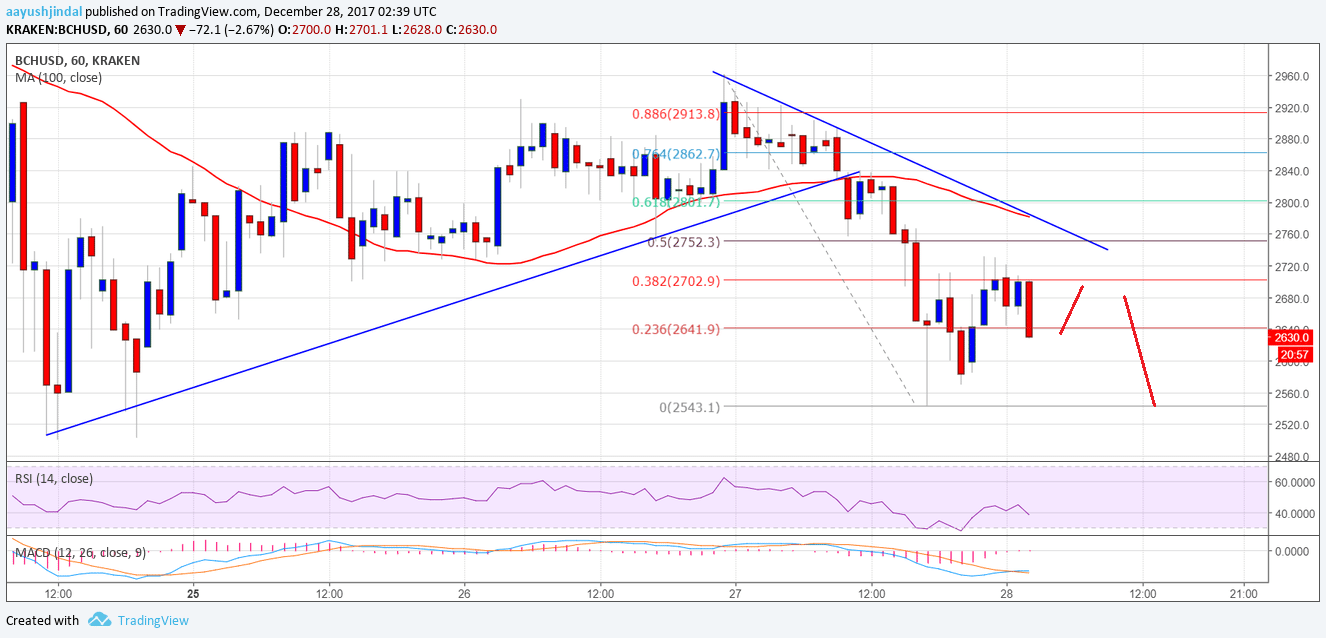
Therefore, it seems like the price is facing a major resistance at $2750. BCH might decline once again and retest the $2500 support area.
Looking at the technical indicators:
Hourly MACD – The MACD for BCH/USD is showing signs of a trend change.
Hourly RSI (Relative Strength Index) – The RSI for BCH/USD is still way below the 50 level.
Major Support Level – $2500
Major Resistance Level – $2750
Charts courtesy – Trading View, Kraken