

Key Points
- Bitcoin cash price declined and broke a major support area at $3400 against the US Dollar.
- Yesterday’s pointed connecting bullish trend line with support at $3450 was broken on the hourly chart of BCH/USD (data feed from Kraken).
- There is now a bearish trend line forming with current resistance at $3000 on the same chart.
Bitcoin cash price struggled to move above $4000 against the US Dollar. BCH/USD broke the $3400 support and moved into the bearish zone.
Bitcoin Cash Price Decline
During the past few days, we saw a decent rise in bitcoin cash price above $3500 against the US Dollar. However, the price failed to move above the $4000 level and started a downside move. First, there was a break below the 61.8% Fib retracement level of the last upside leg from the $2780 low to $3997 high. It opened the doors for more losses toward $3000. Second, there was a break below the $3400 support area, which ignited further declines.
More importantly, yesterday’s pointed connecting bullish trend line with support at $3450 was broken on the hourly chart of BCH/USD. The pair is now trading near the $2650 support and the 100 hourly simple moving average. There is a chance of a minor correction in the short term toward $3000. However, there is a new bearish trend line forming with current resistance at $3000 on the same chart. The trend line resistance could act as a strong resistance and will most likely prevent gains above $3000.
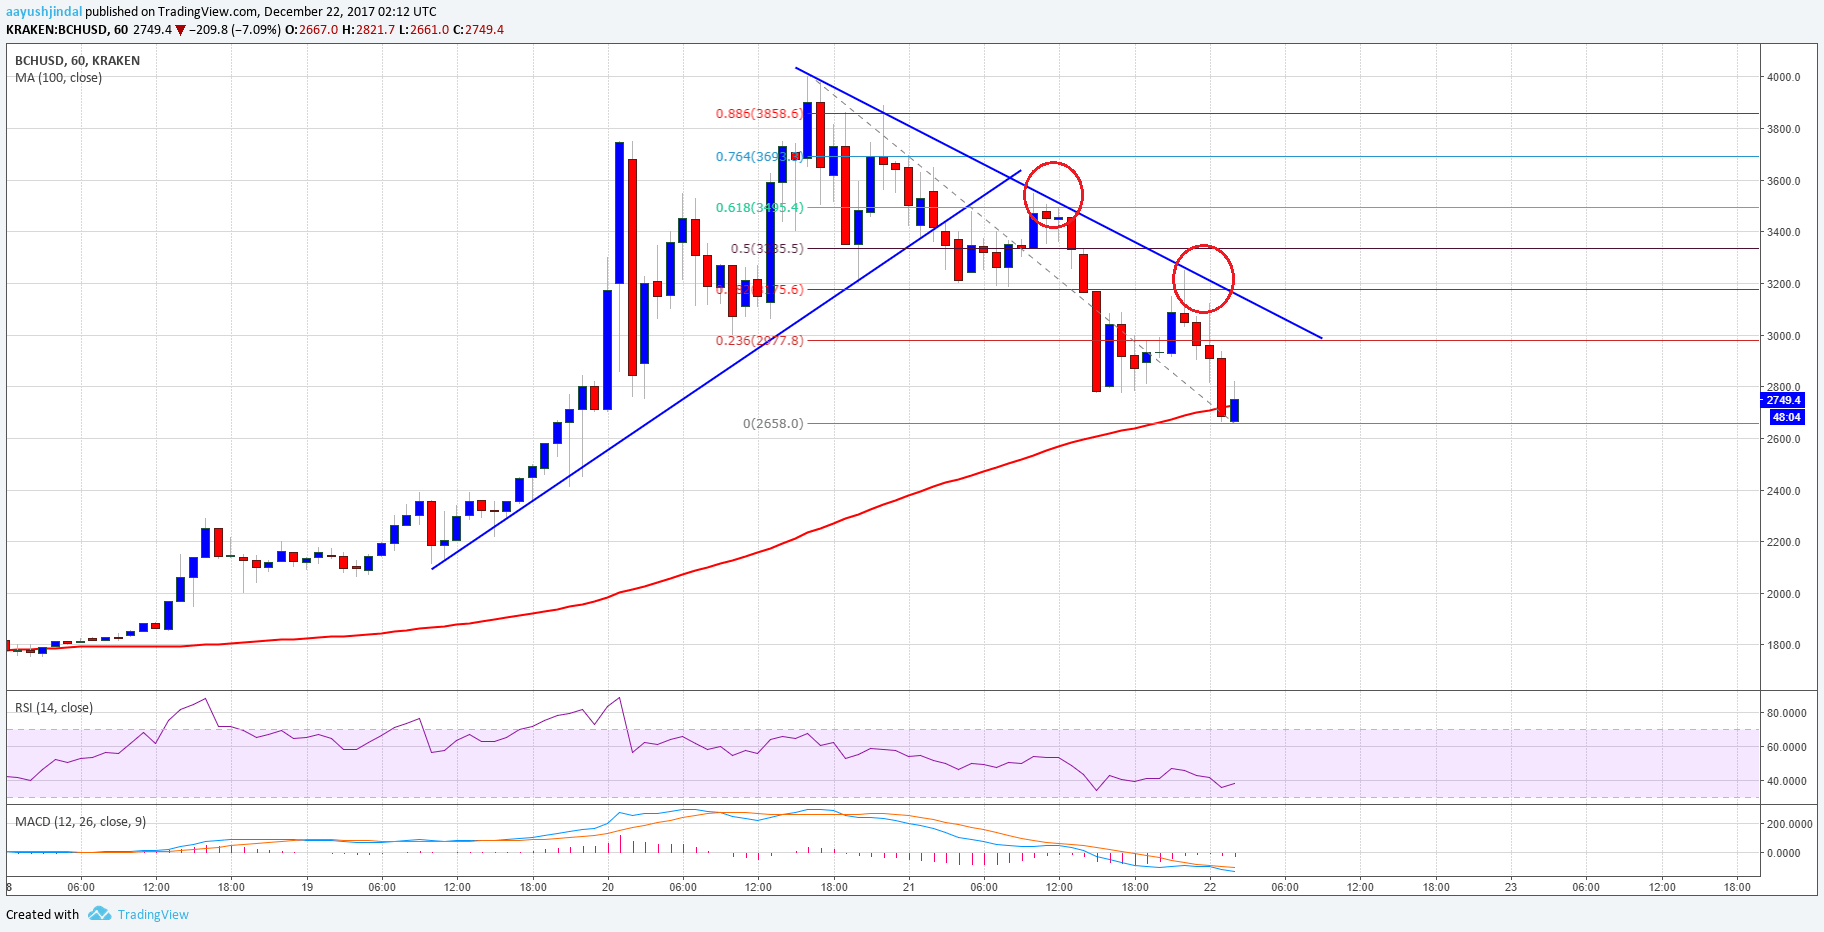
Therefore, if the pair corrects higher from the current levels, it may face sellers near $3000 and $3200. On the downside, a break below the 100 hourly SMA could push the price toward $2200.
Looking at the technical indicators:
Hourly MACD – The MACD for BCH/USD is now back in the bearish zone.
Hourly RSI (Relative Strength Index) – The RSI for BCH/USD is currently around the 30 level.
Major Support Level – $2650
Major Resistance Level – $3000
Charts courtesy – Trading View, Kraken