Key Points
- Bitcoin cash price failed to correct above the $680 level and declined against the US Dollar.
- There was a break below a short-term ascending channel with support at $665 on the hourly chart of the BCH/USD pair (data feed from Kraken).
- The pair may continue to move down and it could retest the $650 support level in the near term.
Bitcoin cash price is struggling to move above the $680 level against the US Dollar. BCH/USD is likely to resume its downside below the $660 level.
Bitcoin Cash Price Resistance
There was a minor upside correction initiated yesterday from the $625 swing low in bitcoin cash price against the US Dollar. The price moved above the $650 resistance to correct higher. It also broke the 23.6% Fib retracement level of the last decline from the $708 swing high to $625 low. Later, it started following a decent bullish path above the $640 level.
However, the price could not gain momentum above the $680 level and the 100 hourly simple moving average. Moreover, the 38.2% Fib retracement level of the last decline from the $708 swing high to $625 low also acted as a resistance for buyers. As a result, there was a downside reaction below the $670 level. More importantly, there was a break below a short-term ascending channel with support at $665 on the hourly chart of the BCH/USD pair. The pair is now trading well below the $680 resistance and it remains at a risk of more losses.
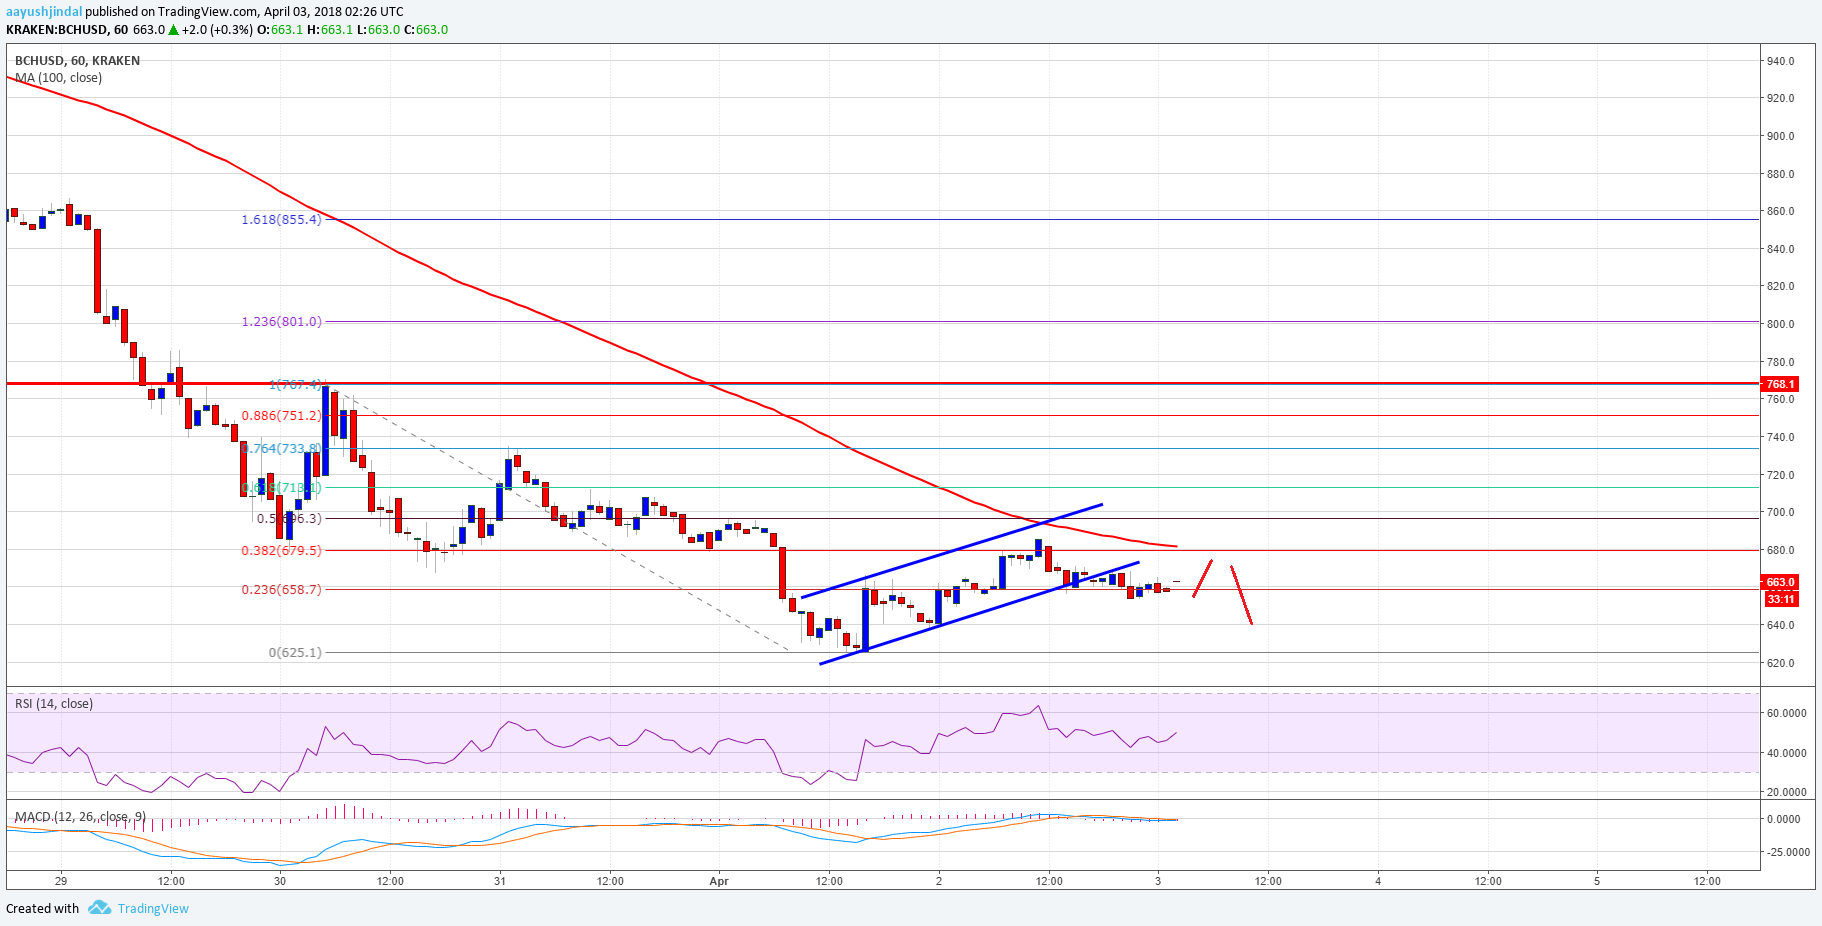

If the pair continue to move down, it could retest the $650 level. Below $650, the price may even retest the last swing low of $625 in the near term.
Looking at the technical indicators:
Hourly MACD – The MACD for BCH/USD is moving back in the bearish zone.
Hourly RSI (Relative Strength Index) – The RSI for BCH/USD is showing a few tiny bullish signs above 40.
Major Support Level – $650
Major Resistance Level – $680
Charts courtesy – Trading View