

Key Points
- Bitcoin cash price started a downside move after it traded as high as $1,834 against the US Dollar.
- There is a crucial bullish trend line in place with support at $1,610 on the hourly chart of the BCH/USD pair (data feed from Kraken).
- The pair is currently testing a major support area near $1,640, which could hold losses in the near term.
Bitcoin cash price remains supported above $1,600 against the US Dollar. BCH/USD is likely to bounce back once the current correction is over.
Bitcoin Cash Price Support
After a sharp upside move, bitcoin cash price formed a short-term top near $1,834 against the US Dollar. The price started a downside correction and declined below the $1,800 and $1,750 support levels. It also traded below the 23.6% Fib retracement level of the last leg from the $1,459 low to $1,834 high. However, there are many supports on the downside above the $1,600 level.
At the moment, the price is testing the 50% Fib retracement level of the last leg from the $1,459 low to $1,834 high at $1,645. The stated $1,645 level is acting as a strong support and preventing losses. Moreover, there is a crucial bullish trend line in place with support at $1,610 on the hourly chart of the BCH/USD pair. Therefore, there seems to be a major support zone above the $1,600 level. As long as the price is above the stated $1,645 and $1,610 support levels, it could bounce back.
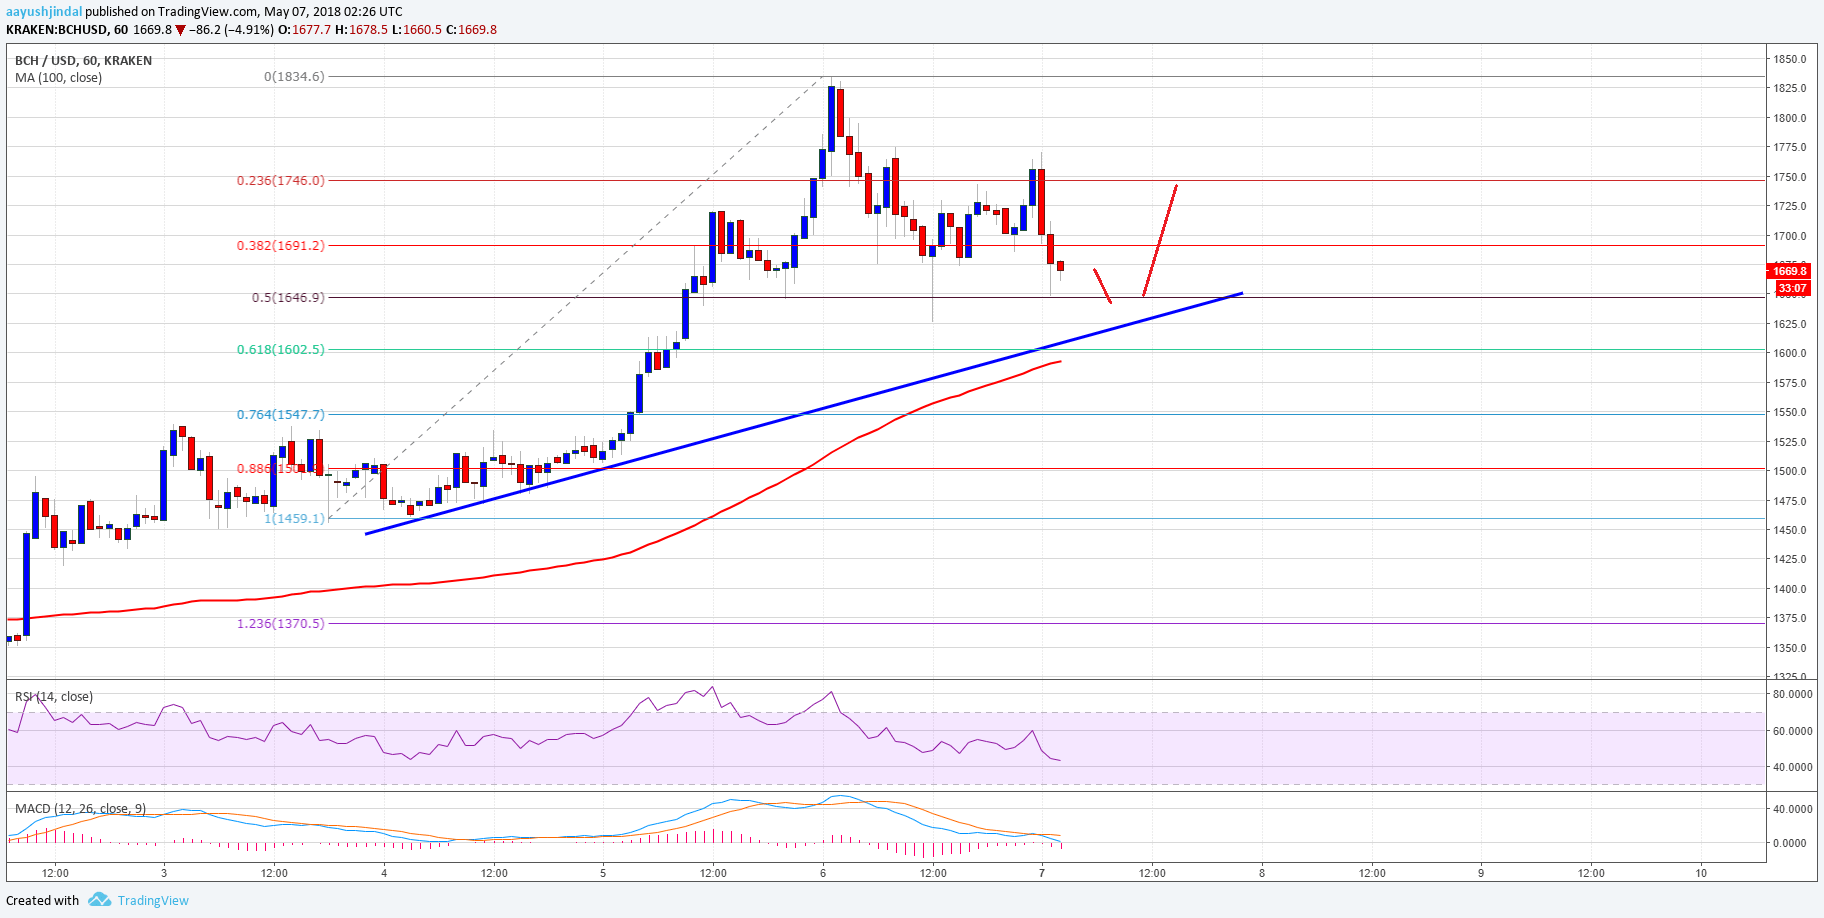

Looking at the chart, there is a short-term resistance forming near the $1,750 level. A break above the stated $1,750 level could open the doors for a push towards the $1,800 level. Finally, a break above $1,834 may perhaps call for a test of $1,900.
Looking at the technical indicators:
Hourly MACD – The MACD for BCH/USD is back in the bearish zone.
Hourly RSI (Relative Strength Index) – The RSI for BCH/USD is now well below the 50 level.
Major Support Level – $1,610
Major Resistance Level – $1,750