

Key Points
- Bitcoin cash price started a recovery and traded above the $1,300 level against the US Dollar.
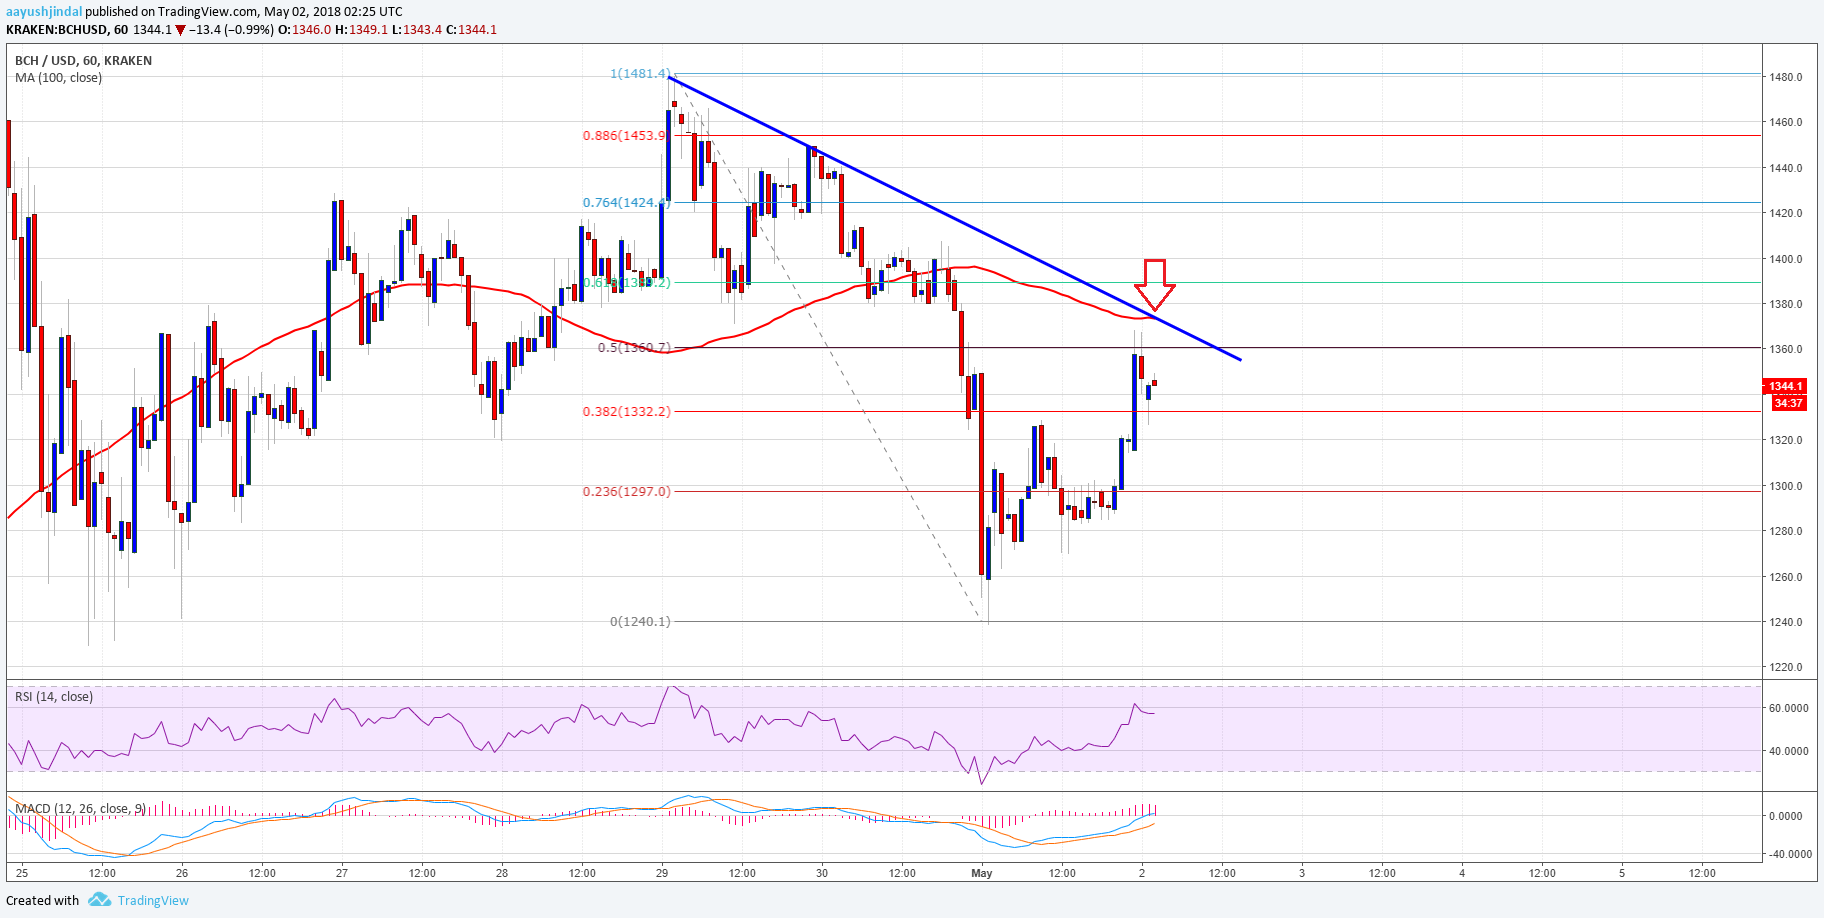
- There is a key connecting bearish trend line forming with resistance at $1,365 on the hourly chart of the BCH/USD pair (data feed from Kraken).
- The pair must break the $1,365-80 resistance and the 100 hourly simple moving average to gain momentum.
Bitcoin cash price is slowly correcting higher against the US Dollar. BCH/USD has to clear the $1,380 hurdle and 100 SMA to move back in a positive zone.
Bitcoin Cash Price Upside Hurdle
After trading as low as $1,240, bitcoin cash price started an upside correction against the US Dollar. The price recovered and moved above the $1,280 and $1,300 resistance level. It also succeeded in breaking the 38.2% Fib retracement level of the last decline from the $1,481 high to $1,240 low. However, the price is now facing a major upside hurdle near the $1,265 and $1,280 levels.
At the moment, the 50% Fib retracement level of the last decline from the $1,481 high to $1,240 low is acting as a resistance. There is also a key connecting bearish trend line forming with resistance at $1,365 on the hourly chart of the BCH/USD pair. The same trend line resistance at $1,365 is near the 100 hourly simple moving average. Therefore, a break above $1,365 and the 100 hourly SMA won’t be easy. Moreover, the price has to surpass the $1,380 level to gain upside momentum in the near term.

Looking at the chart, it’s quite clear that the $1,265 level is a crucial hurdle. On the downside, an initial support is at $1,320. Below the $1,320 support, the price could break the $1,300 support and decline further.
Looking at the technical indicators:
Hourly MACD – The MACD for BCH/USD has moved back in the bullish zone.
Hourly RSI (Relative Strength Index) – The RSI for BCH/USD is now well above the 50 level.
Major Support Level – $1,320
Major Resistance Level – $1,365