
Key Points
- Bitcoin cash price is trading in a positive zone, but is struggling to break the $1,000 resistance against the US Dollar.
- There is a major connecting bearish trend line forming with resistance at $985 on the hourly chart of BCH/USD (data feed from SimpleFX).
- The pair must break the $985 and $1,000 resistance to gain upside momentum in the near term.
Bitcoin cash price struggled to break the $1,000 level against the US Dollar. BCH/USD must clear hurdles near $985 and $1,000 to post further gains.
Bitcoin Cash Price Resistance
Yesterday, we saw a decent start to a new recovery in bitcoin cash price above $800 against the US Dollar. The price traded above the $850 and $900 resistance levels. However, the upside move was protected by a major resistance near $1,000. Moreover, the 100 hourly simple moving average is also preventing gains near the $980 and $1,000 levels.
More importantly, there is a major connecting bearish trend line forming with resistance at $985 on the hourly chart of BCH/USD. The trend line resistance acted as a barrier and is currently preventing an upside break. On the downside, an initial support is around the 23.6% Fib retracement level of the wave from the $748 low to $1,021 high. There are many important supports on the downside if the pair fails near the $1,000 level. The most important one is near $880 and the 50% Fib retracement level of the wave from the $748 low to $1,021 high.
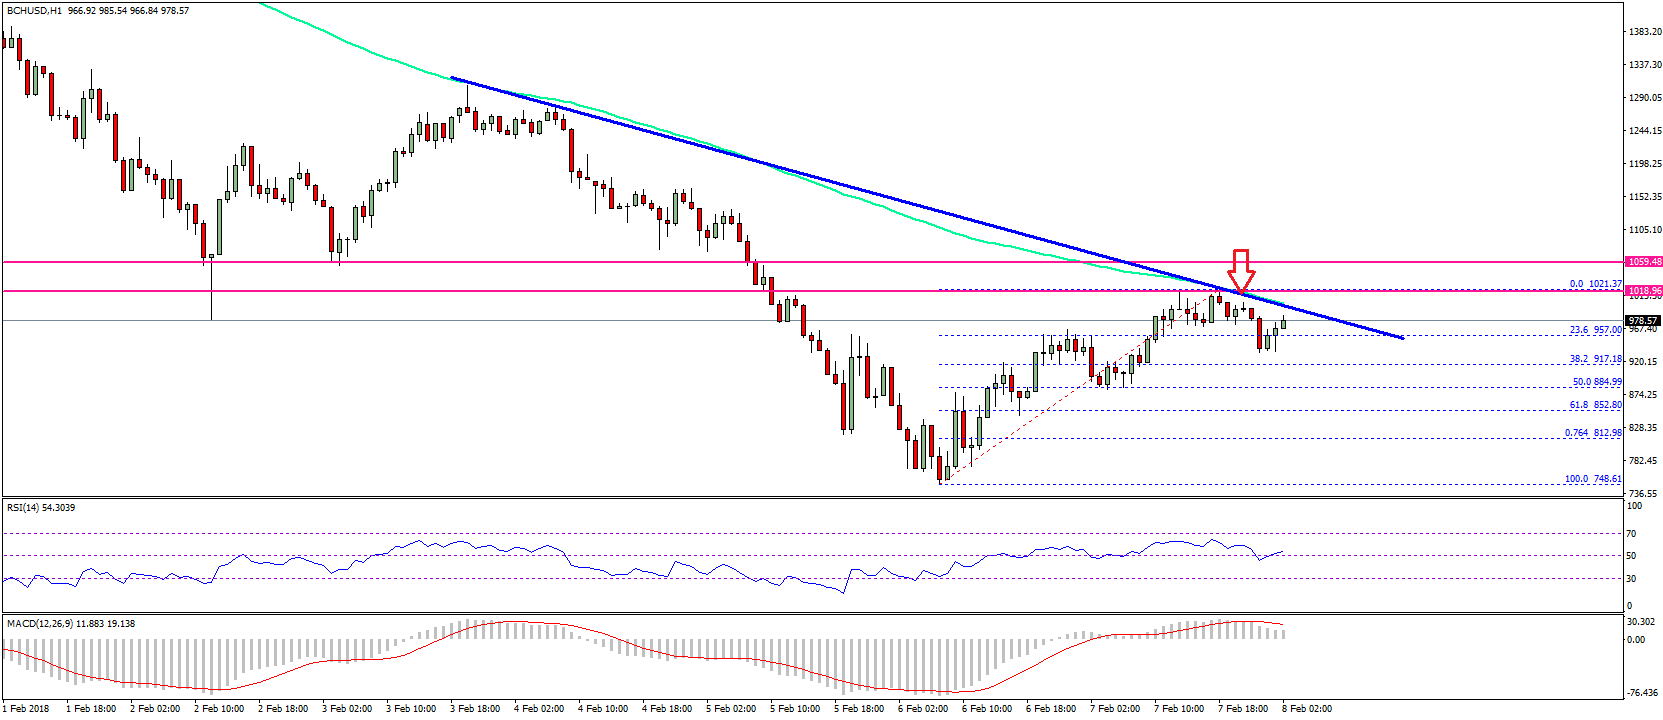

On the upside, a break and close above the $1,000 level could open the doors for more gains towards $1,100 in the near term. Above $1,100, the price may test $1,150.
Looking at the technical indicators:
Hourly MACD – The MACD for BCH/USD is placed nicely in the bullish zone.
Hourly RSI (Relative Strength Index) – The RSI for BCH/USD is back above the 50 level and is moving north.
Major Support Level – $880
Major Resistance Level – $1,000
Charts courtesy – SimpleFX