Key Points
- Bitcoin cash price is struggling to break the $1,280-90 resistance area against the US Dollar.
- There is a short-term connecting bullish trend line forming with support at $1,220 on the hourly chart of BCH/USD (data feed from SimpleFX).
- The pair must stay above the $1,200 level to move further higher towards the $1,350 level.
Bitcoin cash price is facing a tough challenge below the $1,300 level against the US Dollar. BCH/USD has to gain strength above $1,280 to rise further.
Bitcoin Cash Price Trend
There was an attempt recently to move above the $1,280 and $1,290 resistance levels in bitcoin cash price against the US Dollar. However, the price faced a lot of sellers near $1,290 and it could not move above the $1,300 level. As a result, there was a downside move and the price broke the $1,250 support. There was also a break below the 23.6% Fib retracement level of the last wave from the $1,125 low to $1,282 high.
The downside move is currently finding support near $1,220. There is also a short-term connecting bullish trend line forming with support at $1,220 on the hourly chart of BCH/USD. Moreover, the 38.2% Fib retracement level of the last wave from the $1,125 low to $1,282 high is acted as a support. If the pair fails to stay above the $1,220 level, it could test the 100 hourly simple moving average. An intermediate support is around the 50% Fib retracement level of the last wave from the $1,125 low to $1,282 high.
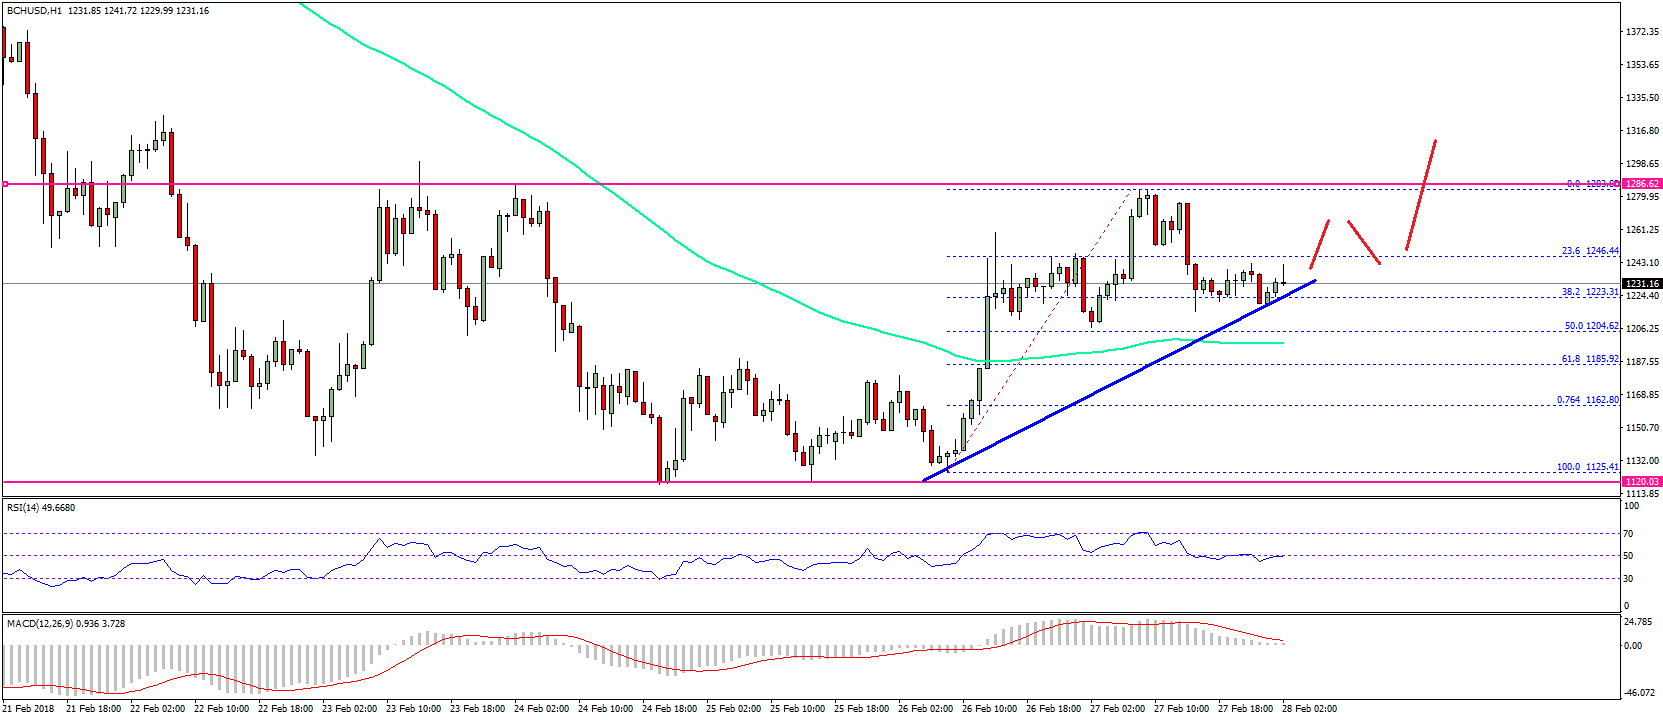

On the upside, a break above the $1,280-90 zone is needed for more gains. Above $1,290, the price may perhaps move above $1,300 for a test of $1,350.
Looking at the technical indicators:
Hourly MACD – The MACD for BCH/USD is currently reducing its bullish slope.
Hourly RSI (Relative Strength Index) – The RSI for BCH/USD is now just below the 50 level.
Major Support Level – $1,220
Major Resistance Level – $1,280
Charts courtesy – SimpleFX