Key Points
- Bitcoin cash price started a decent upside move and traded above the $1,200 resistance against the US Dollar.
- There was a partial break above yesterday’s highlighted bearish trend line with resistance at $1,220 on the hourly chart of BCH/USD (data feed from SimpleFX).
- The pair is correcting lower, but it is above the $1,200 level and the 100 hourly simple moving average.
Bitcoin cash price made a positive move above $1,200 against the US Dollar. BCH/USD must stay above 100 hourly SMA to gain further upside momentum.
Bitcoin Cash Price Support
Yesterday, we saw how there was a key support forming above the $1,100 level in bitcoin cash price against the US Dollar. The price started a slow and steady rise and it was able to move above the $1,160 resistance. There was also a break above the 61.8% Fib retracement level of the last downside wave from the $1,285 high to $1,116 low. It opened the doors for more gains and the price settled above $1,200 and the 100 hourly simple moving average.
More importantly, there was a partial break above yesterday’s highlighted bearish trend line with resistance at $1,220 on the hourly chart of BCH/USD. The pair traded as high as $1,263 and it is currently correcting lower. It has moved below the 23.6% Fib retracement level of the last wave from the $1,125 low to $1,263 high. It is currently testing the broken trend line at $1,210. On the downside, the 50% Fib retracement level of the last wave from the $1,125 low to $1,263 high is at $1,195 to act as a support. Moreover, the stated $1,195 level is also near the 100 hourly SMA.
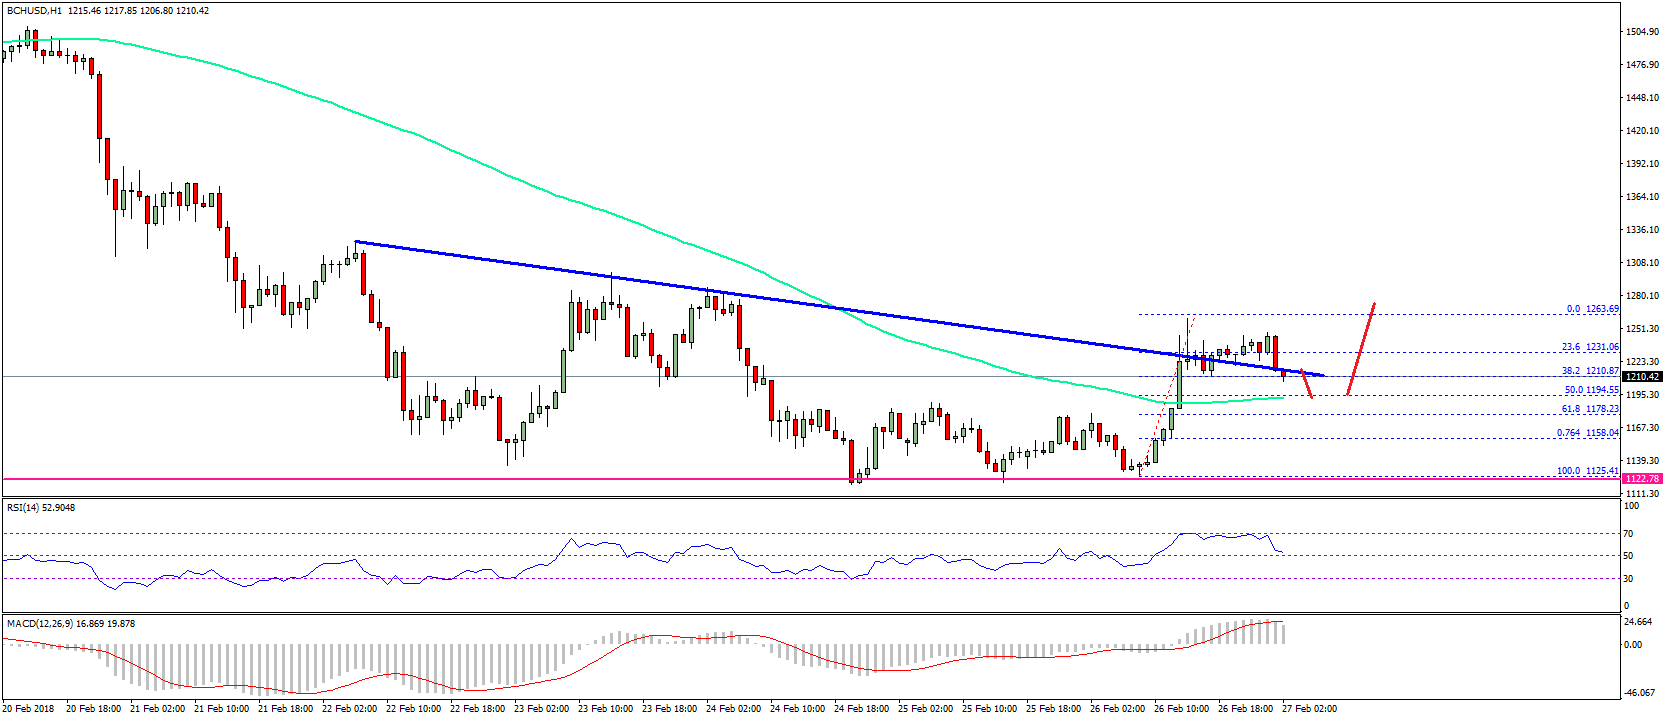

Therefore, as long as the price is above $1,190 and the 100 hourly SMA, it could rise once again.
Looking at the technical indicators:
Hourly MACD – The MACD for BCH/USD is now back in the bullish zone.
Hourly RSI (Relative Strength Index) – The RSI for BCH/USD is moving lower towards the 50 level.
Major Support Level – $1,190
Major Resistance Level – $1,250
Charts courtesy – SimpleFX