
Key Points
- Bitcoin cash price made a nice upside move this past week and traded above $1,100 against the US Dollar.
- At the moment, the BCH/USD pair is attempting to settle below a major bullish trend line with support at $1,200 on the 4-hours chart (data feed from SimpleFX).
- The pair may correct lower in the short term towards the $1,120 and $1,080 levels.
Bitcoin cash price surged higher before facing sellers near $1,375 against the US Dollar. BCH/USD is currently correcting lower and it could retest the $1,080 support.
Bitcoin Cash Price Upside Hurdle
This past week, there was a sharp upside move initiated in bitcoin cash price from the $980 swing low against the US Dollar. The price climbed above the 23.6% Fib retracement level of the last major decline from the $1,764 high to $748 low. The upside move was strong as the price was able to move above the $1,000 and $1,200 resistance levels.
There was even a break above the 50% Fib retracement level of the last major decline from the $1,764 high to $748 low. However, the upside move was protected by the $1,375-80 levels and the 100 simple moving average (4-hours). Furthermore, the price failed to move above the 61.8% Fib retracement level of the last major decline from the $1,764 high to $748 low. At the moment, the price is correcting lower and is trading below the $1,250 level. More importantly, the BCH/USD pair is attempting to settle below a major bullish trend line with support at $1,200 on the 4-hours chart.
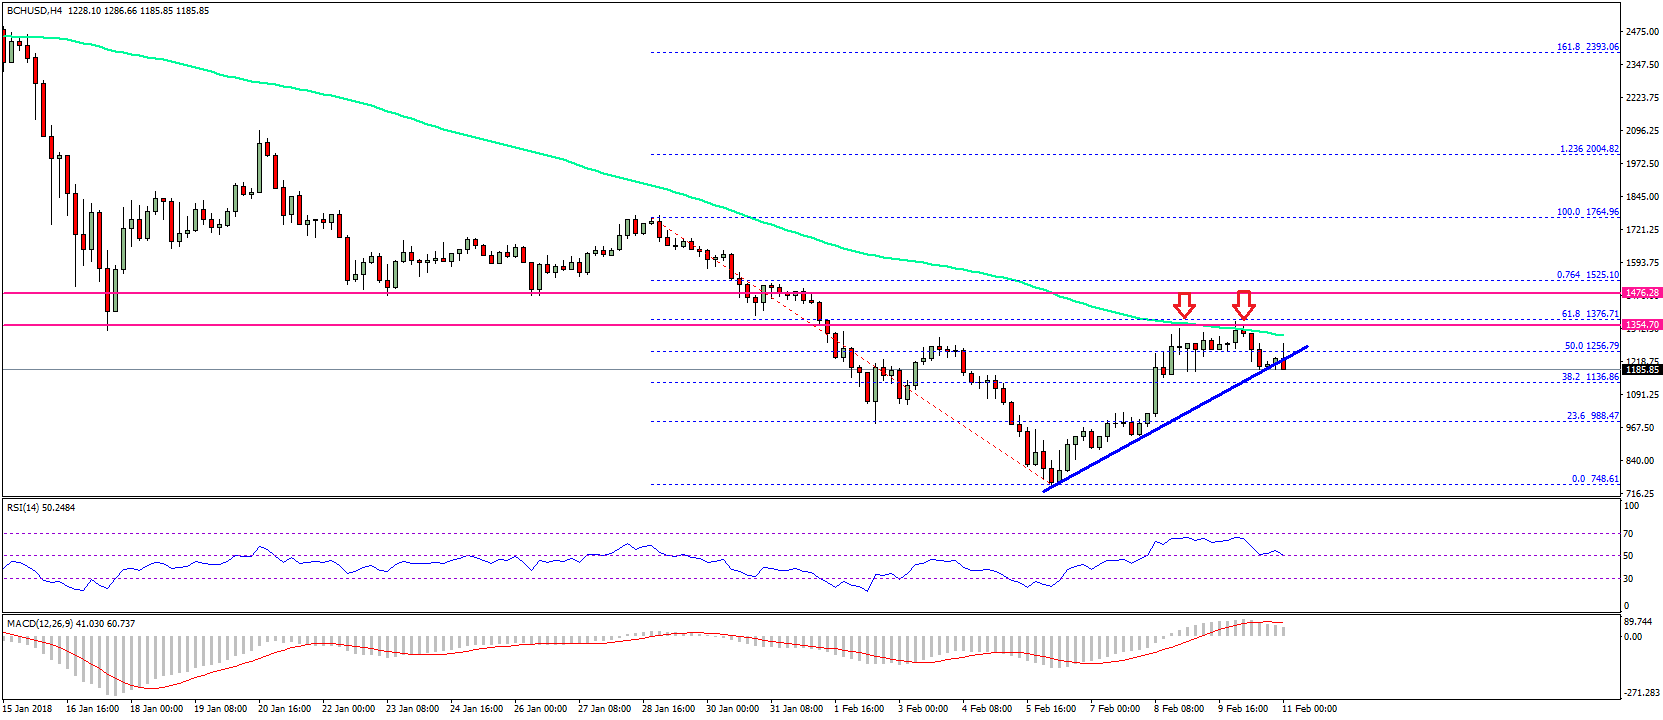

If the pair settles below the $1,180 level, it could decline further. The most important support and buy zone on the downside is around the $1,080 level.
Looking at the technical indicators:
4-hours MACD – The MACD for BCH/USD is currently reducing its bullish slope.
4-hours RSI (Relative Strength Index) – The RSI for BTC/USD is just around the 50 level.
Major Support Level – $1,080
Major Resistance Level – $1,380
Charts courtesy – SimpleFX