

Key Points
- Bitcoin cash price is following a decreasing slope and is facing sellers near $1480-1500 against the US Dollar.
- There are two major bearish trend lines forming with resistance at $1410 and $1440 on the 4-hours chart of BCH/USD (data feed from Kraken).
- The pair is currently moving down and is approaching the $1150-1100 support area.
Bitcoin cash price is struggling to gain traction above $1500 against the US Dollar. BCH/USD has to stay above $1100 to avoid any further declines.
Bitcoin Cash Price Upside Hurdle
There were a couple of swing moves in bitcoin cash price above the $1400 level against the US Dollar. However, the price failed to gain momentum every time above $1500. It also failed to move above the $1600 once and is currently facing sellers near the 100 simple moving average (4-hours). Recently, the price traded higher from the $1140 low. It moved above the 50% Fib retracement level of the last decline from the $1610 high to $1140 low.
However, the price was rejected from $1480 and the price moved below the $1350 support area. Moreover, the 61.8% Fib retracement level of the last decline from the $1610 high to $1140 low acted as a hurdle. More importantly, there are two major bearish trend lines forming with resistance at $1410 and $1440 on the 4-hours chart of BCH/USD. These trend lines around $1450 and the 100 simple moving average (4-hours) are acting as major upside hurdles for buyers.
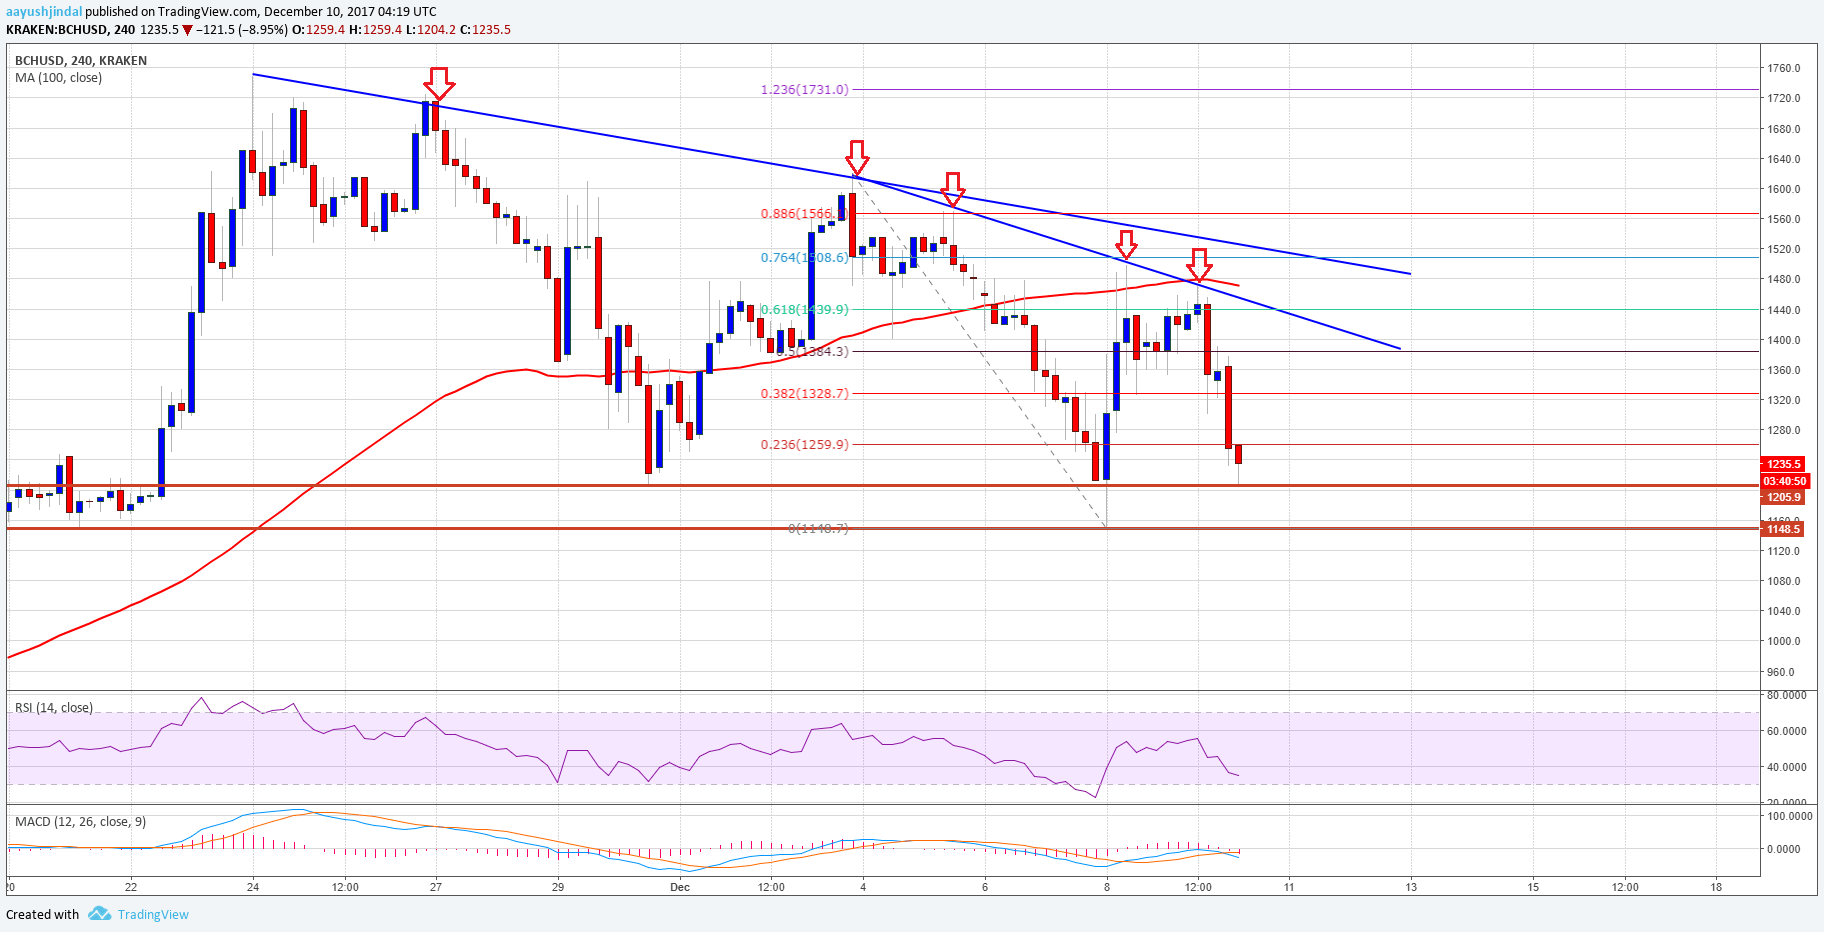
The price is now moving lower once again towards the $1200 level. On the downside, the most important support is around the $1140-1100 zone. The pair has to stay above the mentioned $1100 support in order to avoid more declines in the near term.
Looking at the technical indicators:
4-hours MACD – The MACD for BCH/USD is now in the bearish zone.
4-hours RSI (Relative Strength Index) – The RSI for BTC/USD is heading lower towards the 35 level.
Major Support Level – $1100
Major Resistance Level – $1450
Charts courtesy – Trading View, Kraken