

Key Points
- Bitcoin cash price found support around the $1,275 level after a major decline against the US Dollar.
- There is a major bearish trend line forming with resistance near $1,500 on the 4-hours chart of the BCH/USD pair (data feed from Kraken).
- The pair may continue to find sellers on the upside near the $1,480 and $1,500 levels in the near term.
Bitcoin cash price declined towards $1,250 against the US Dollar. BCH/USD is correcting higher, but upsides remain capped by the $1,500 level.
Bitcoin Cash Price Resistance
This past week, bitcoin cash price trimmed most of its gains and declined from the $1,700 level against the US Dollar. The price declined sharply and moved below the $1,500 and $1,300 support levels. It traded close to the $1,250 support and a low was formed at $1,276. At the moment, the price is correcting higher and is trading above the $1,350 level.
It also moved above the 23.6% Fib retracement level of the last decline from the $1,677 high to $1,276 low. However, the price is facing a lot of sellers around the $1,475 level. It also represents a crucial pivot zone, acting as a barrier for buyers near $1,500. It was a support earlier and is now preventing gains above $1,500. The 50% Fib retracement level of the last decline from the $1,677 high to $1,276 low is also around $1,475. There is also a major bearish trend line forming with resistance near $1,500 on the 4-hours chart of the BCH/USD pair.
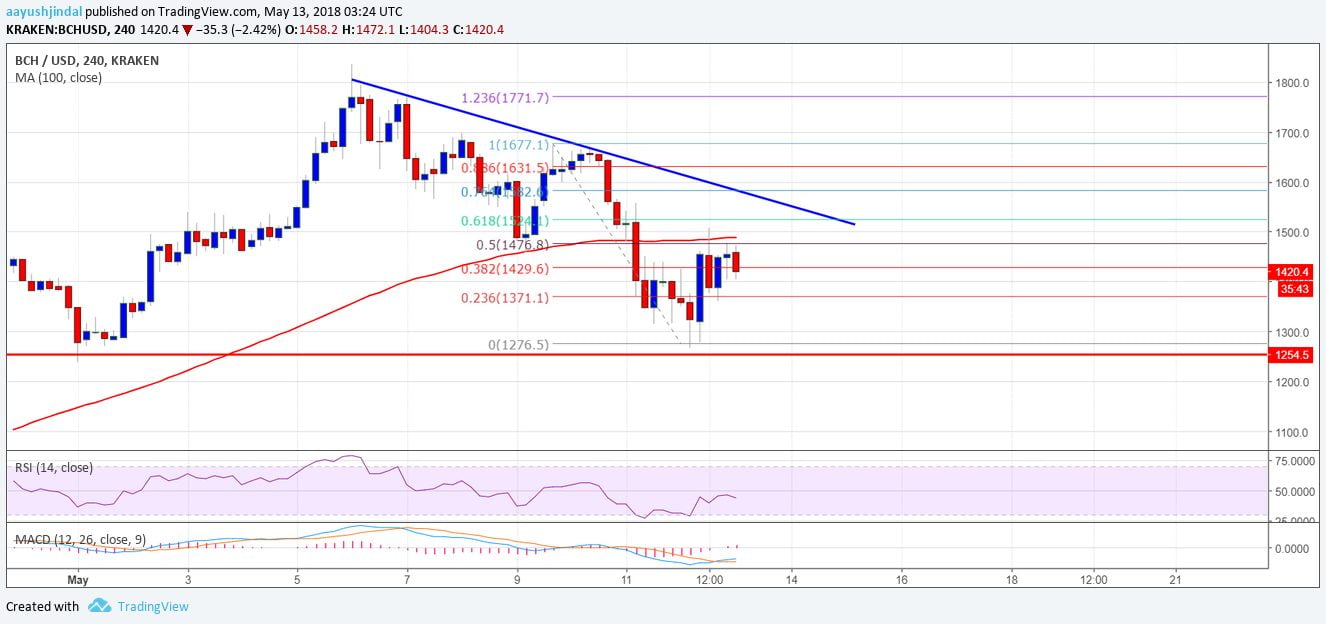

Looking at the chart, the price is clearly facing hurdles near $1,475 and $1,500. Moreover, the 100 hourly simple moving average is also near $1,475 to prevent gains. A break above the $1,500 level could open the doors for more gains towards $1,600.
Looking at the technical indicators:
4-hours MACD – The MACD for BCH/USD is slowly moving into the bullish zone.
4-hours RSI (Relative Strength Index) – The RSI for BTC/USD is currently just below the 50 level.
Major Support Level – $1,380
Major Resistance Level – $1,500