Key Points
- Bitcoin cash price is trading above the $1,120 support with a neutral bias against the US Dollar.
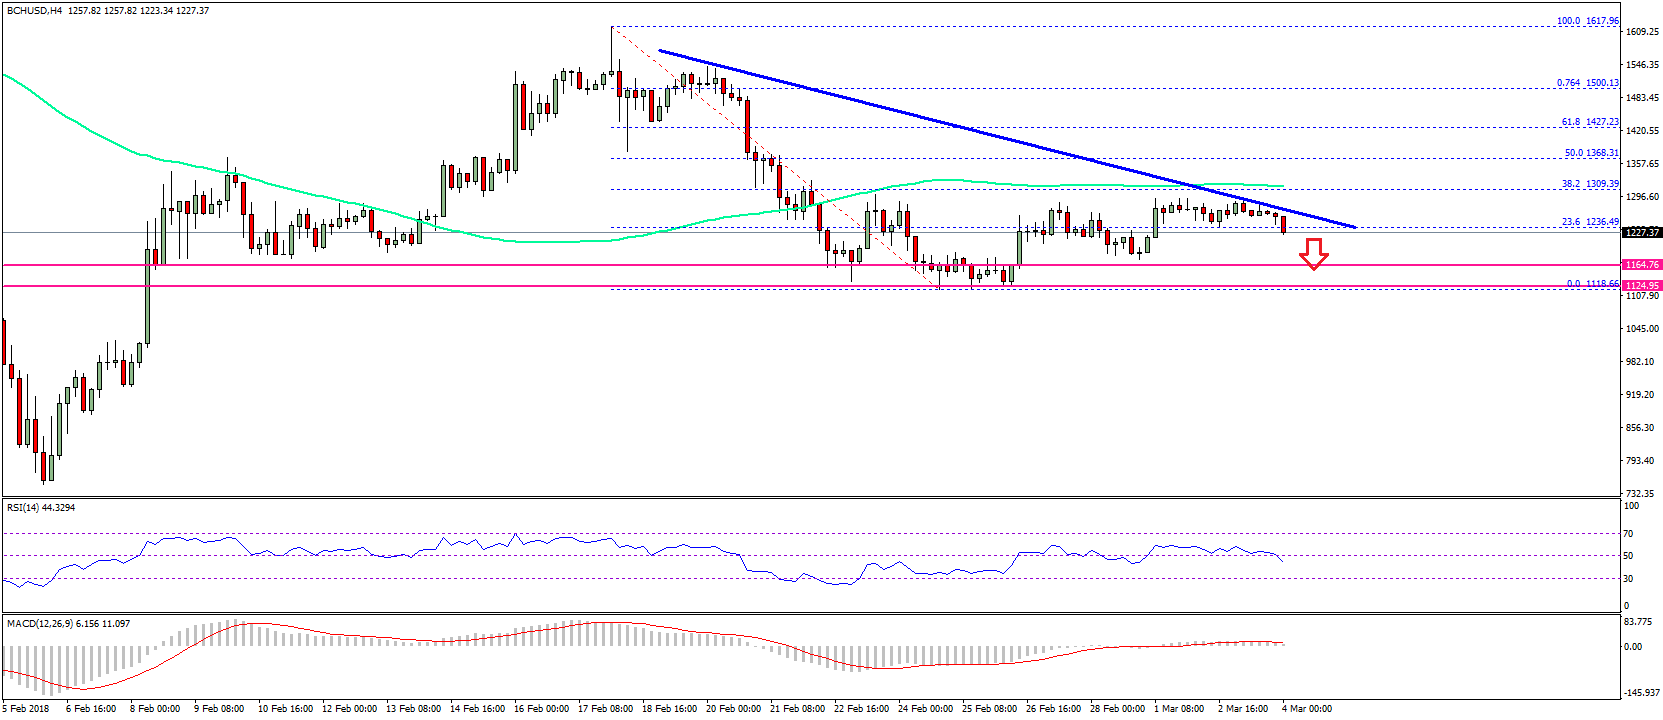
- There is a key bearish trend line forming with resistance at $1,295 on the 4-hours chart of the BCH/USD pair (data feed from SimpleFX).
- The pair is trading with a neutral bias as long as it is above the $1,120 in the near term.
Bitcoin cash price is finding it hard to move higher above $1,300 against the US Dollar. BCH/USD must break the $1,300 resistance to more gains in the near term.
Bitcoin Cash Price Upside Hurdle
There was no major upside move above the $1,300 resistance in bitcoin cash price against the US Dollar. The price made a nice upside move around the $1,250 and $1,300 resistance levels. However, the price was not able to move above $1,300 and started a downside move. A low was formed $1,118 from where a minor upside correction was initiated.
It moved above the 23.6% Fib retracement level of the last drop from the $1,617 high to $1,118 low. However, the upside move faced sellers near $1,300 and the 100 simple moving average (4-hour). Moreover, there is a key bearish trend line forming with resistance at $1,295 on the 4-hours chart of the BCH/USD pair. Furthermore, the 38.2% Fib retracement level of the last drop from the $1,617 high to $1,118 low prevented gains. There are a few bearish signs and it may move down back towards the $1,150 support level. Below the $1,150 support, the next support level is around the $1,120 level.

On the upside, the price must break the $1,300 resistance and the 100 SMA to gain bullish momentum toward $1,500.
Looking at the technical indicators:
4-hours MACD – The MACD for BCH/USD is mostly flat in the bearish zone.
4-hours RSI (Relative Strength Index) – The RSI for BTC/USD has moved below the 50 level.
Major Support Level – $1,120
Major Resistance Level – $1,300
Charts courtesy – SimpleFX