

- Ripple price failed to break the $0.4080 and $0.4100 resistance levels against the US dollar.
- The price declined recently and broke the key $0.4020 and $0.4000 support levels.
- This week’s followed key bullish trend line was breached with support near $0.4015 on the hourly chart of the XRP/USD pair (data source from Kraken).
- The price is now trading well below $0.4000 and it may continue to struggle in the near term.
Ripple price is struggling to continue higher above $0.4100 against the US Dollar, and declined heavily vs bitcoin. XRP price could revisit the $0.3850 support before a decent recovery.
Ripple Price Analysis
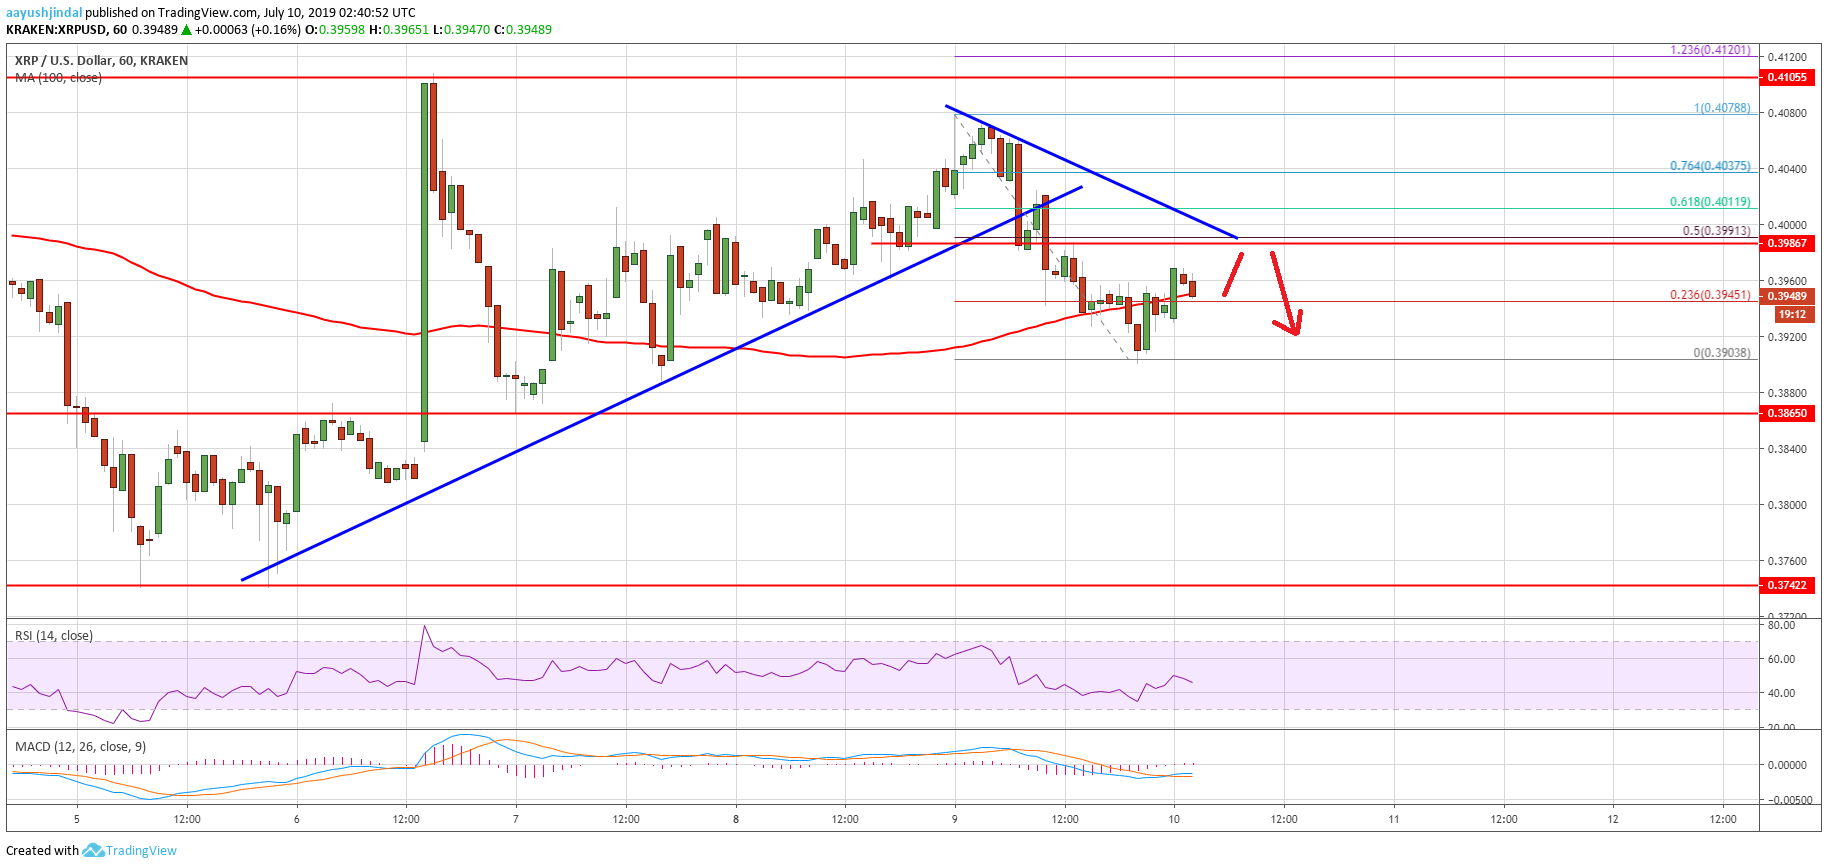
In the past two sessions, bitcoin price extended gains above $12,800 and $13,000. However, ripple price failed to break the $0.4080 and $0.4100 resistance levels. The last swing high was near the $0.4078 and recently the price declined below the $0.4040 support. Moreover, there was a break below key $0.4020 and $0.4000 support levels. The price even spiked below the $0.3920 support and the 100 hourly simple moving average.
More importantly, this week’s followed key bullish trend line was breached with support near $0.4015 on the hourly chart of the XRP/USD pair. The pair traded as low as $0.3903 and it is currently correcting higher. It broke the $0.3940 level plus the 23.6% Fib retracement level of the recent decline from the $0.4078 swing high to $0.3903 low.
On the upside, there are a few important resistances formed near the $0.3990 and $0.4000 levels. Moreover, the 50% Fib retracement level of the recent decline from the $0.4078 swing high to $0.3903 low is near the $0.3990 level to act as a resistance. There is also a connecting bearish trend line forming with resistance near $0.4000 on the same chart for ripple.
Therefore, a successful close above the $0.3900 and $0.4000 levels is needed for a fresh recovery. However, the price may continue to struggle near the $0.4080 and $0.4100 resistance levels. A convincing break above the $0.4100 level is needed for a sharp recovery in the coming sessions.
Looking at the chart, ripple price seems to be facing many hurdles on the upside such as $0.4000, $0.4080 and $0.4100. Therefore, as long as the price is below $0.4100, there is a risk of more losses. An immediate support is near $0.3850, below which the price may revisit the main $0.3750 support level.
Technical Indicators
Hourly MACD – The MACD for XRP/USD is likely to move back in the bullish zone.
Hourly RSI (Relative Strength Index) – The RSI for XRP/USD is currently well above the 50 level, with a bearish angle.
Major Support Levels – $0.3900, $0.3850 and $0.3750.
Major Resistance Levels – $0.4000, $0.4080 and $0.4100.