

- Bitcoin price is currently consolidating above the $10,300 level against the US Dollar.
- The price seems to be struggling to break the $10,400 and $10,500 resistance levels.
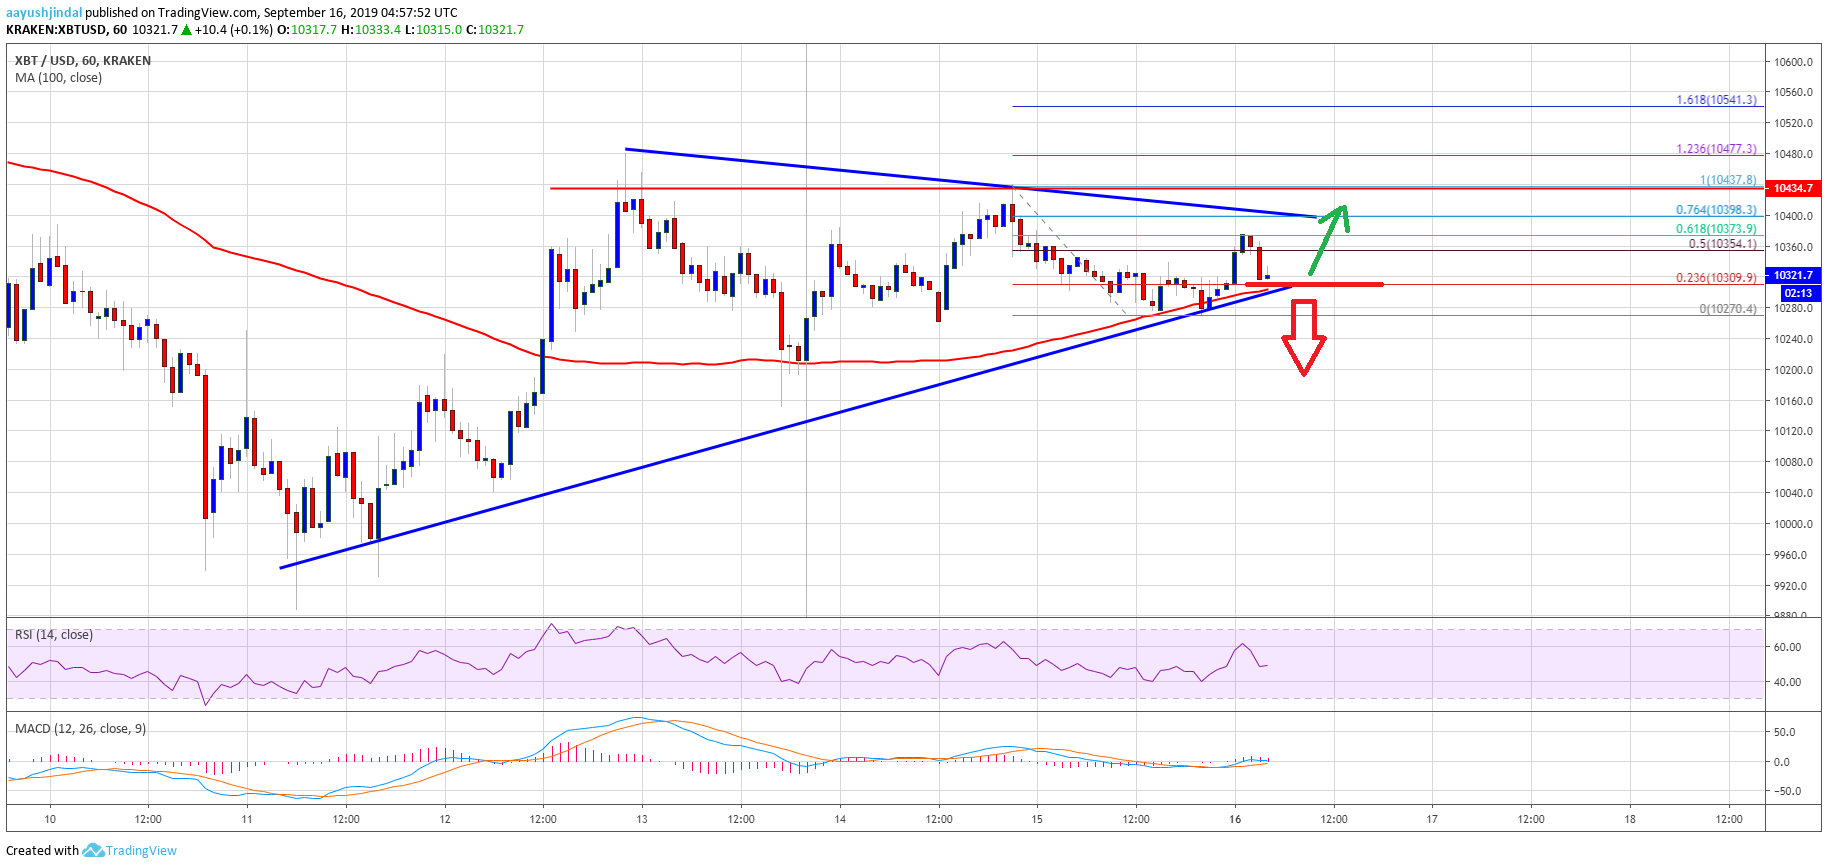
- There is a breakout pattern forming with resistance near $10,400 on the hourly chart of the BTC/USD pair (data feed from Kraken).
- The price could either climb above $10,400 or it might start a fresh decline below $10,250.
Bitcoin price is holding an important support near $10,300 against the US Dollar. BTC could rise steadily towards $10,500 as long as it is above $10,250 and $10,300.
Bitcoin Price Analysis
Recently, bitcoin struggled to gain momentum above the $10,400 resistance area against the US Dollar. The last swing high was formed near $10,437 before the price started a downside correction. On the other hand, there was a solid upward move in Ethereum above the $185 and $186 resistance levels. At the outset, BTC price is trading well below the $10,400 resistance level.
The last swing low was near $10,270 and recently the price corrected higher. It broke the $10,320 and $10,350 levels, plus remained well above the 100 hourly simple moving average. Moreover, there was a break above the 50% Fib retracement level of the recent decline from the $10,437 high to $10,270 low. However, the upward move was capped by the $10,375 level.
It seems like the 61.8% Fib retracement level of the recent decline from the $10,437 high to $10,270 low is acting as a hurdles. More importantly, there is a breakout pattern forming with resistance near $10,400 on the hourly chart of the BTC/USD pair. If bitcoin breaks the trend line support near $10,300 and the 100 hourly SMA, there could be a downside extension. An immediate support is near the $10,250 level, below which the price could head towards $10,000.
Conversely, if there is an upside break above $10,400, the price could start another rise. The next major resistances are near $10,440 and $10,500. If the bulls remain in action above $10,500, the price could start a strong upward move above the $10,550 and $10,600 levels.
Looking at the chart, bitcoin price is clearly preparing for the next break either above $10,400 or below $10,250. The current price action suggests that the price could rise steadily towards $10,500 as long as it is above the 100 hourly SMA. If not, there are chances of a fresh drop towards the $10,000 support area.
Technical indicators:
Hourly MACD – The MACD is slowly moving back into the bearish zone.
Hourly RSI (Relative Strength Index) – The RSI for BTC/USD is moving higher towards the 50 level.
Major Support Levels – $10,300 followed by $10,250.
Major Resistance Levels – $10,400, $10,440 and $10,500.