
Reason to trust
How Our News is Made
Strict editorial policy that focuses on accuracy, relevance, and impartiality
Ad discliamer
Morbi pretium leo et nisl aliquam mollis. Quisque arcu lorem, ultricies quis pellentesque nec, ullamcorper eu odio.
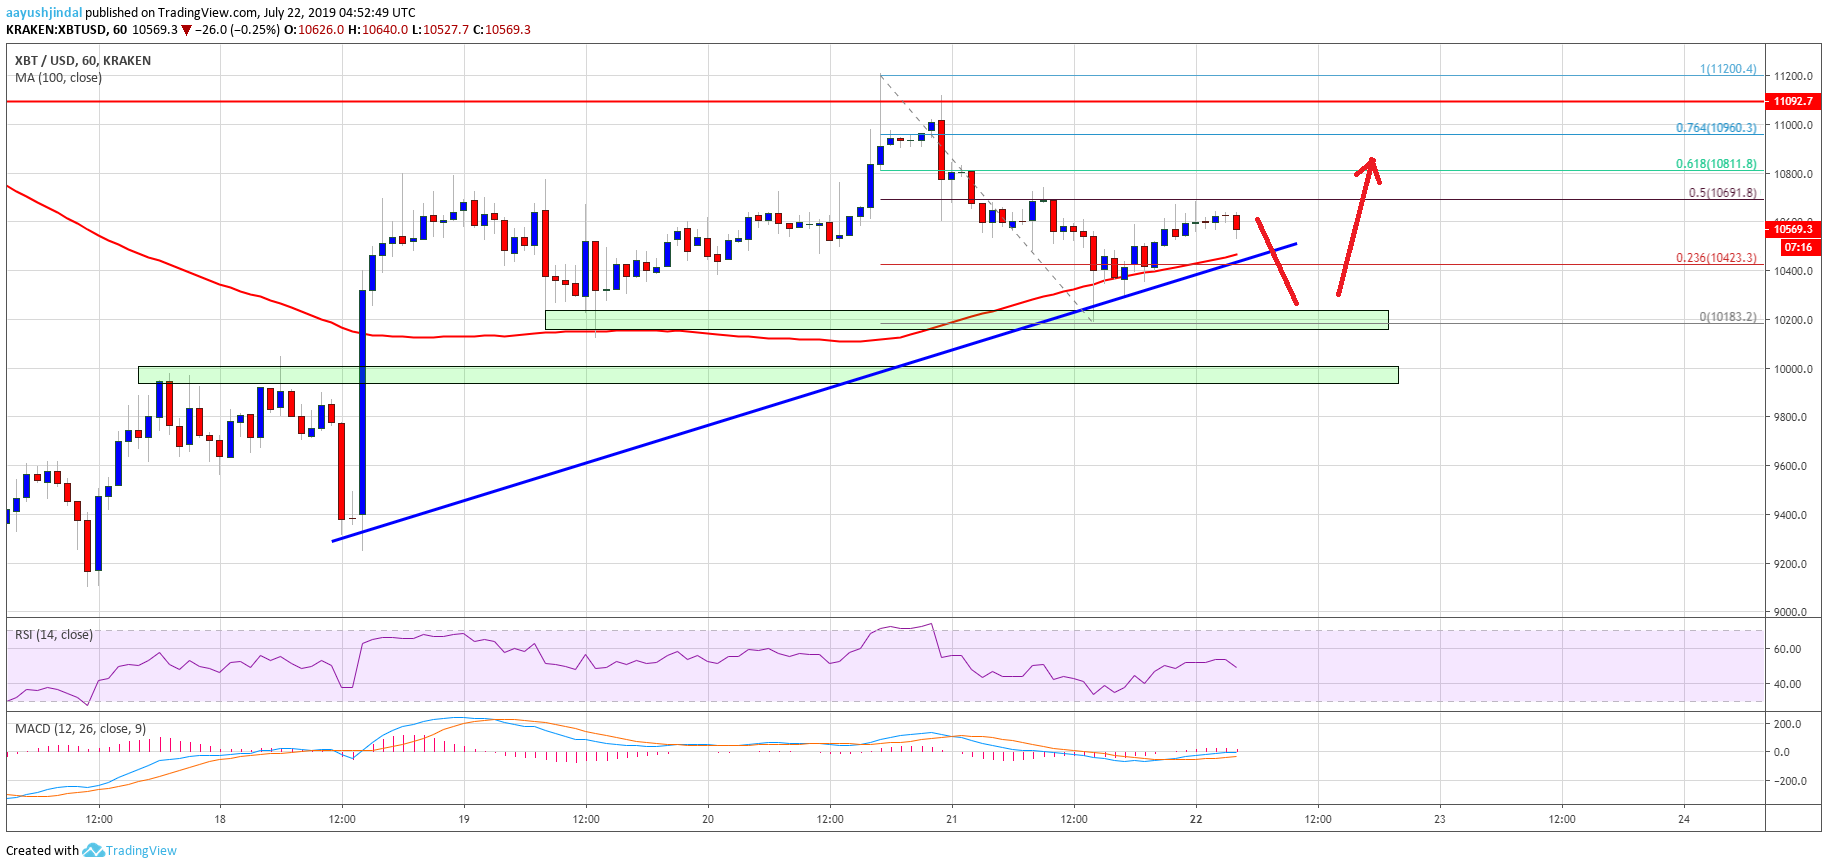
- Bitcoin price climbed higher recently above the $11,000 resistance level against the US Dollar.
- The price spiked towards $11,200 and recently corrected lower below $10,800.
- There is a connecting bullish trend line forming with support near $10,450 on the hourly chart of the BTC/USD pair (data feed from Kraken).
- The price could retest the key $10,000 support level before it could rise again towards $11,000.
Bitcoin price is struggling to continue higher above $10,800 support against the US Dollar. Therefore, BTC price might decline towards $10,000 before it could start a fresh increase.
Bitcoin Price Analysis
After a successful close above the $10,000 pivot level, bitcoin price extended gains against the US Dollar. The BTC/USD pair broke the $10,500 and $10,800 resistance levels. Moreover, the pair settled above the $10,500 level and the 100 hourly simple moving average. Finally, the price broke the $11,000 resistance level. Finally, a new swing high was formed near $11,200 and recently the price started a downside correction.
The price traded below the $10,800 support level to start the correction. It even broke the $10,500 support level and spiked towards the $10,000 level. A swing low was formed near $10,018 and the price found support near the 100 hourly simple moving average. Bitcoin price started a decent rise and broke the $10,400 level. Moreover, there was a break above the 23.6% Fib retracement level of the recent slide from the $11,200 high to $10,018 low.
However, the upward move is facing hurdles near the $10,700 level. More importantly, the 50% Fib retracement level of the recent slide from the $11,200 high to $10,018 low is capping the upward move. At the moment, the price is struggling to gain momentum above the $10,700 and $10,800 levels.
Therefore, if there is an upside break above $10,800, there are chances of more gains above $11,000. On the downside, there are many supports near the $10,500 level. Moreover, there is a connecting bullish trend line forming with support near $10,450 on the hourly chart of the BTC/USD pair. If there is a downside break below the trend line and the 100 hourly SMA, there could be more downsides towards $10,000 in the coming sessions.
Looking at the chart, bitcoin price is clearly struggling to gain traction above $10,800. Therefore, if the bulls continue to struggle, there are chances of a downside thrust towards the $10,000 support level before BTC climbs higher again towards $11,200.
Technical indicators:
Hourly MACD – The MACD is slowly moving back into the bearish zone.
Hourly RSI (Relative Strength Index) – The RSI for BTC/USD is currently moving lower and is below the 50 level.
Major Support Levels – $10,400 followed by $10,000.
Major Resistance Levels – $10,800, $11,000 and $11,200.


