

- Bitcoin price started a strong recovery above the $8,000 and $8,200 resistance against the US Dollar.
- The price is up more than 5%, but it is facing a strong resistance near the $8,500 level.
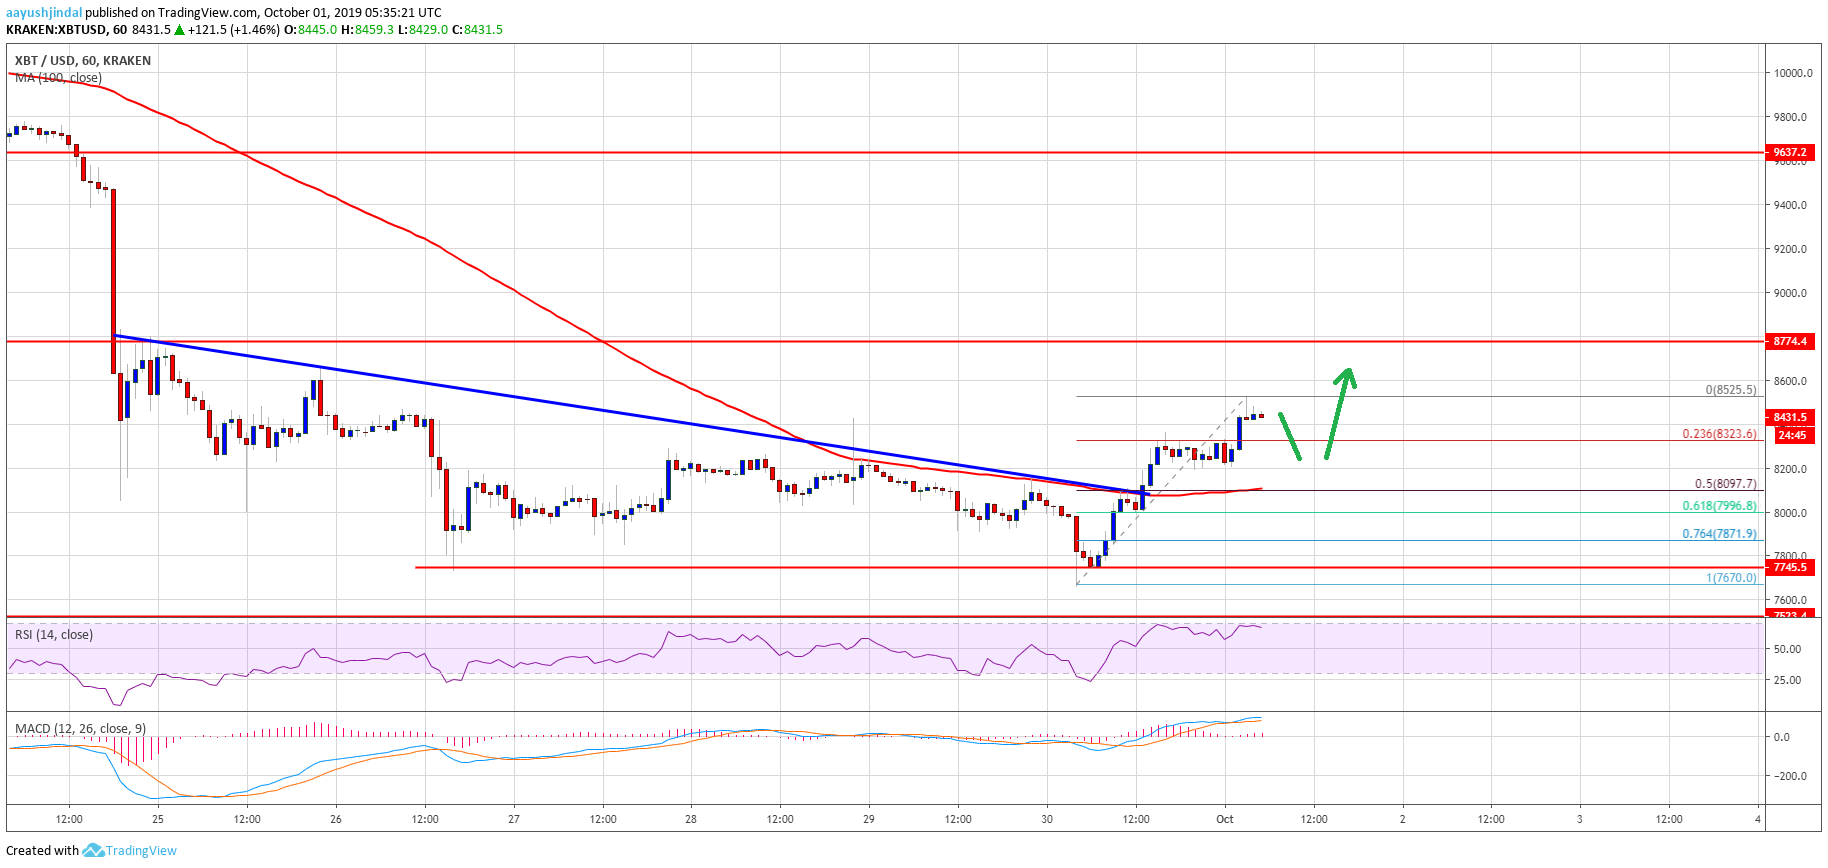
- Yesterday’s highlighted major bearish trend line was breached with resistance near $8,080 on the hourly chart of the BTC/USD pair (data feed from Kraken).
- The price could dip a few points before it makes another attempt to climb above $8,500 and $8,600.
Bitcoin price is showing signs of an upside correction against the US Dollar. However, BTC is facing two important hurdles near the $8,500 and $8,750 levels.
Bitcoin Price Analysis
After trading to a new monthly low at $7,670, bitcoin started an upside correction against the US Dollar. The BTC/USD pair broke the $8,000 resistance level to start the recent recovery. Moreover, there was a close above the $8,000 level and the 100 hourly simple moving average. As a result, the price climbed above the $8,150 and $8,200 resistance levels.
More importantly, yesterday’s highlighted major bearish trend line was breached with resistance near $8,080 on the hourly chart of the BTC/USD pair. The pair gained strength above $8,300 and surpassed $8,400. It even spiked above the $8,500 level and traded to a new weekly high at $8,525. At the moment, it seems like the price is facing resistance near the $8,500 level.
It might correct lower towards the $8,350 or $8,320 support. Moreover, the 23.6% Fib retracement level of the recent wave from the $7,670 low to $8,525 high is near $8,323 to provide support. If the price fails to stay above $8,300, it could correct lower towards the key $8,050 and $8,000 support levels. Besides, the 50% Fib retracement level of the recent wave from the $7,670 low to $8,525 high could provide support near $8,100.
The 100 hourly SMA is also positioned near the $8,100 level to act as a support. Therefore, a close below $8,000 and the 100 hourly SMA might push the price back into a bearish zone. On the upside, an immediate resistance is near the $8,500 level. However, the main resistance is near the $8,750 level (the previous support area).
Looking at the chart, bitcoin seems to be correcting higher above $8,300. Having said that, there are two important barriers for the bulls – $8,500 and $8,750. If they succeed in clearing $8,750, the price could rise sharply towards $9,000 and $9,200.
Technical indicators:
Hourly MACD – The MACD is now moving nicely in the bullish zone.
Hourly RSI (Relative Strength Index) – The RSI for BTC/USD is currently well above the 60 level.
Major Support Levels – $8,300 followed by $8,100.
Major Resistance Levels – $8,500, $8,750 and $9,000.