

- Bitcoin price traded to a new monthly high at $12,333 and corrected lower sharply against the US Dollar.
- The price is currently climbing higher after it tested the key $11,200 support area.
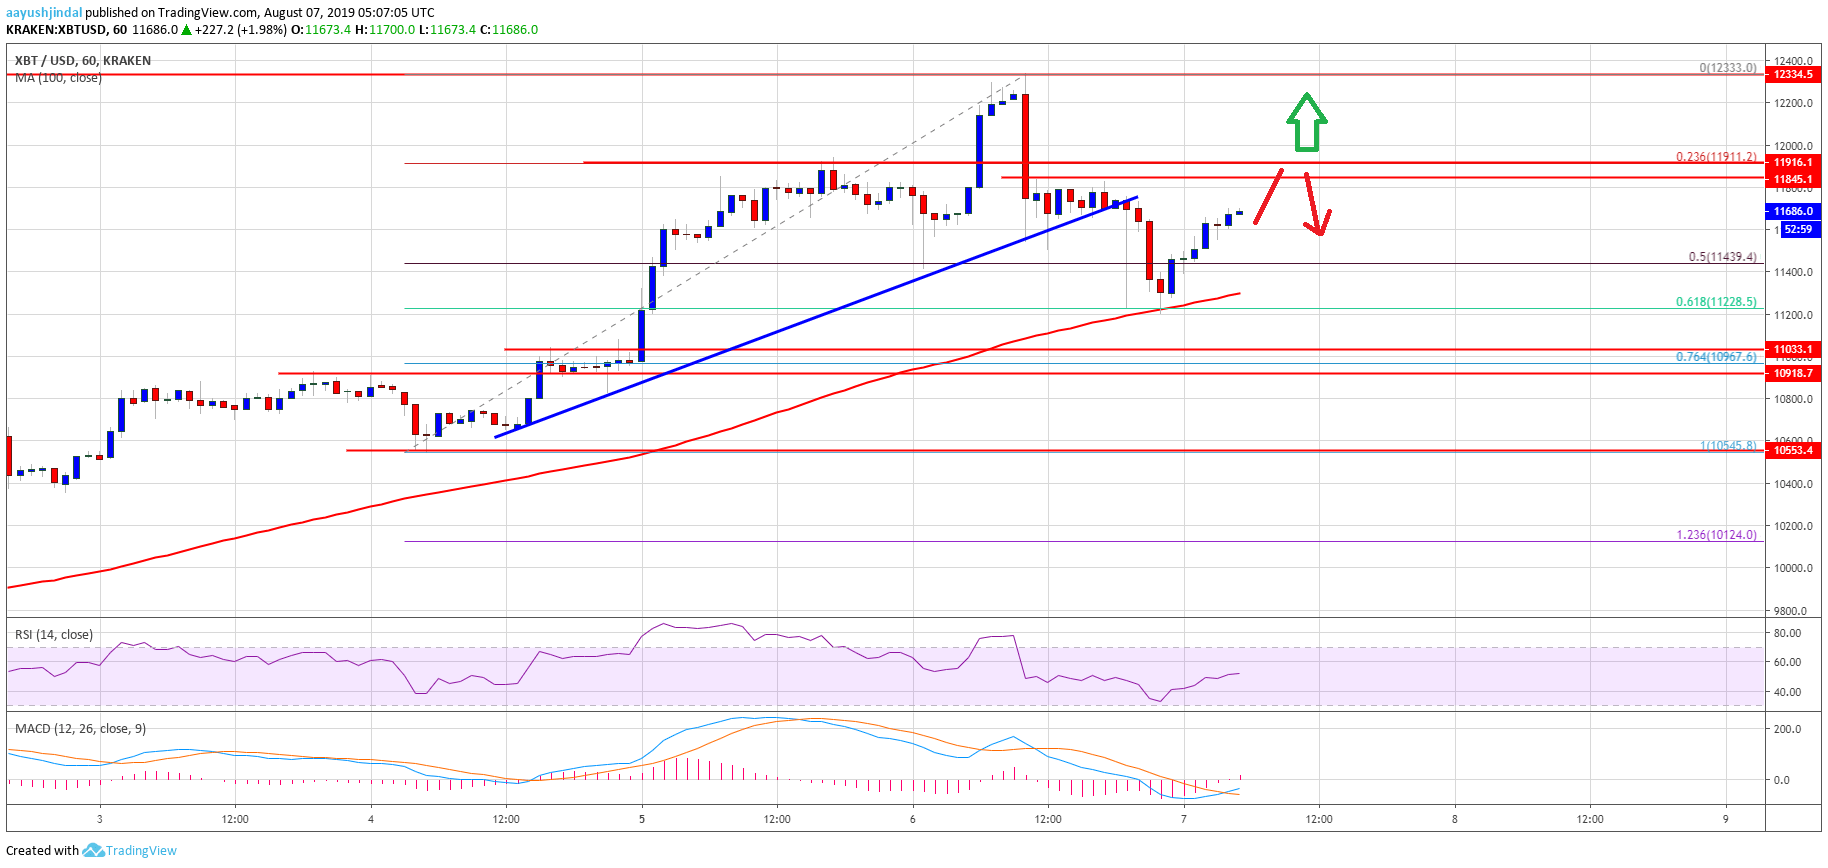
- Yesterday’s highlighted key bullish trend line was breached with support near $11,700 on the hourly chart of the BTC/USD pair (data feed from Kraken).
- The price could revisit the $12,000 resistance, which is now a major breakout zone.
Bitcoin price is recovering from $11,200 against the US Dollar. However, BTC price must break the $12,000 resistance to continue higher in the coming sessions.
Bitcoin Price Analysis (BTC/USD)
Yesterday, there was a sharp rally in bitcoin price above the $12,000 resistance against the US Dollar. The BTC/USD pair even traded above the second bullish target of $12,200 (as discussed in one of the previous analysis). The pair traded to a new monthly high at $12,333 and corrected lower sharply. It traded below the $12,000 and $11,800 support levels. Furthermore, there was a break below the key $11,500 support area.
The price even traded below the 50% Fib retracement level of the recent rally from the $10,545 low to $12,333 high. More importantly, yesterday’s highlighted key bullish trend line was breached with support near $11,700 on the hourly chart of the BTC/USD pair. The pair tested the next key support near the $11,200 level and the 100 hourly simple moving average.
Moreover, the 61.8% Fib retracement level of the recent rally from the $10,545 low to $12,333 high acted as a decent support area. Bitcoin price formed a base above the $11,200 level and it is currently correcting higher. It is trading above the $11,500 level, with a bullish angle. However, there is a major resistance forming near the $11,850 and $12,000 levels.
Therefore, a successful break above the $12,000 level is needed for a fresh rally. The next key resistances are near $12,200 and $12,350. Conversely, if the price fails to surpass the $11,850 and $12,000 levels, there could be another decline. An immediate support is near the $11,500 level. The main support is near the $11,200 level and the 100 hourly SMA.
Looking at the chart, bitcoin price is clearly facing an uphill task near the $11,850 and $12,000 resistance levels. Having said that, the price is likely to gain bullish momentum as long as it is trading above the $11,200 support and the 100 hourly SMA
Technical indicators:
Hourly MACD – The MACD is slowly moving back into the bullish zone.
Hourly RSI (Relative Strength Index) – The RSI for BTC/USD is currently near the 50 level, with a minor bearish angle.
Major Support Levels – $11,500 followed by $11,200.
Major Resistance Levels – $11,850, $12,000 and $12,200.