

On Thursday evening, shortly before the markets closed in Europe, we published our twice-daily bitcoin price watch piece. In the piece, we highlighted levels that we were watching throughout the Asian session on Thursday evening, and suggested how we would get in and out markets according to our intraday breakout strategy if we reached broke the levels that we were keeping an eye on. Now action has matured overnight, and the bitcoin price has carved out fresh set of key levels to watch. With this said, what of levels that we are watching today, and how might we get in and out of the markets on any volatility? Take a quick look at the chart.
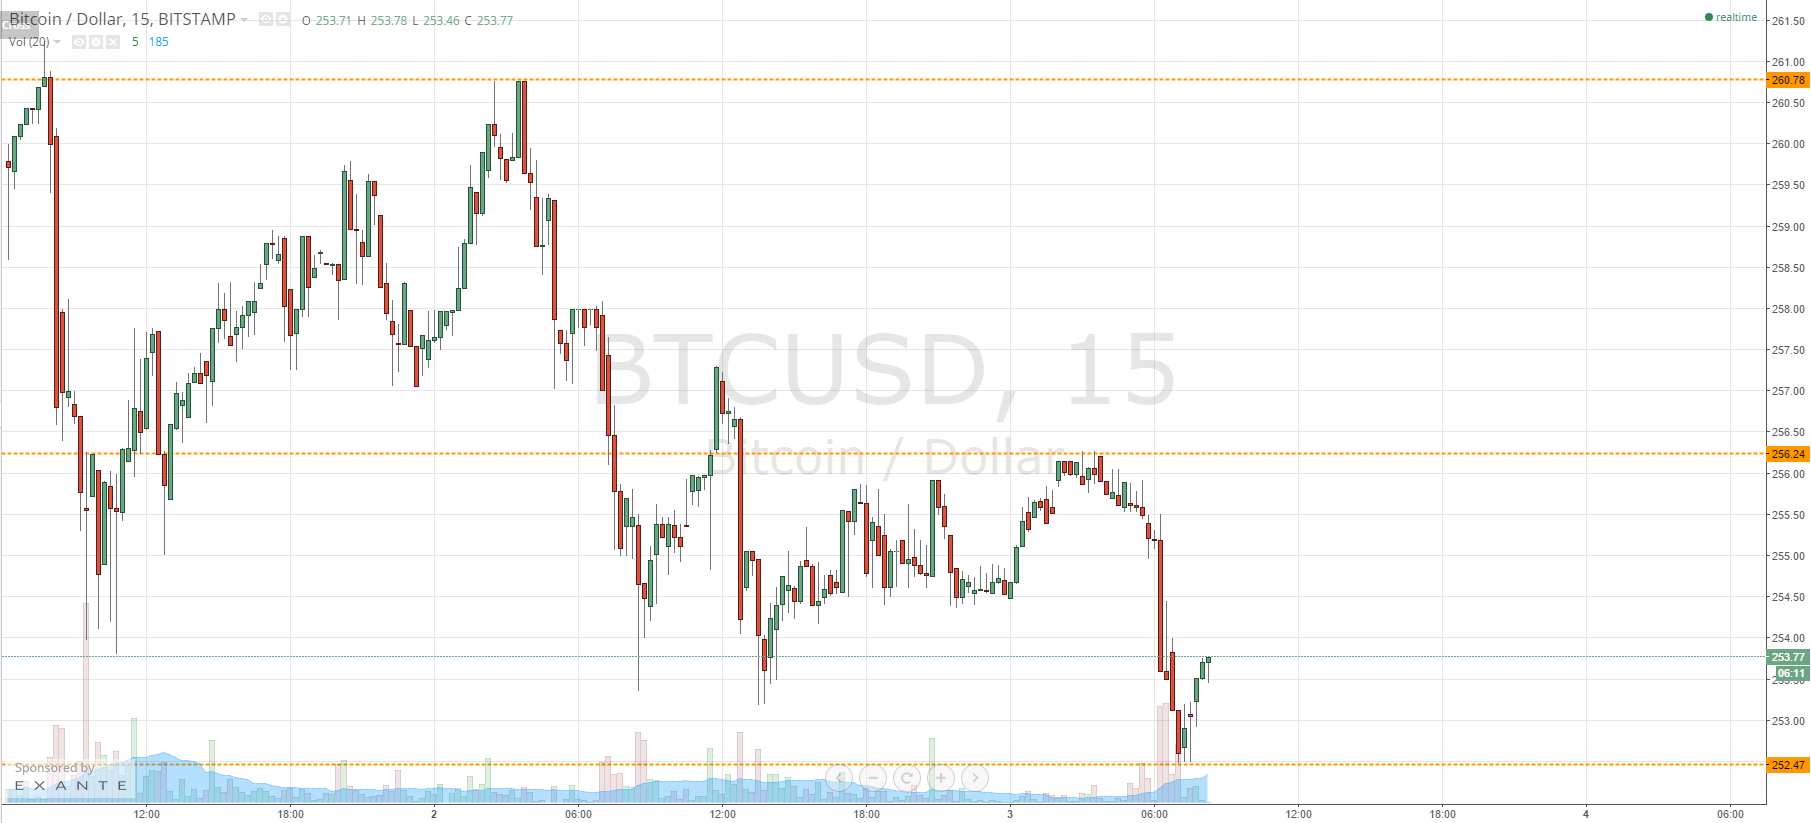
As you see from the chart, action overnight has continued to trend in the overarching direction we saw throughout the majority of this week – to the downside. The levels that we are watching today are in term support at 252.47 (current intraday lows) and in term resistance at 256.24 (current intraday highs.
First, let’s look to the downside. If we can get a break below 252.47, it will put us short towards an initial downside target of 248 flat. A stop loss on this trade somewhere around 253.5 will maintain a positive risk reward profile and take as out of the trade in the event that we get a bias reversal.
Looking the other way, if we can get a bounce from current support, we would look to enter a long trade towards in term resistance at 256.24. A stop loss just below 252 flat will keep things attractive from a risk management perspective. Following on from that, if we get a break above in term resistance, it will put us long towards a medium-term upside target of 260.78, with a stop loss somewhere around 255 flat.
Charts courtesy of Trading View