Bitcoin Price Key Highlights
- Bitcoin price is still consolidating on its higher time frames, moving inside a symmetrical triangle pattern on the daily and 4-hour chart.
- Price just bounced off the triangle support and might be ready for a test of resistance.
- Technical indicators are suggesting that the consolidation might carry on from here.
Bitcoin price might keep forming lower highs and higher lows, staying inside its long-term consolidation pattern.
Technical Indicators Signals
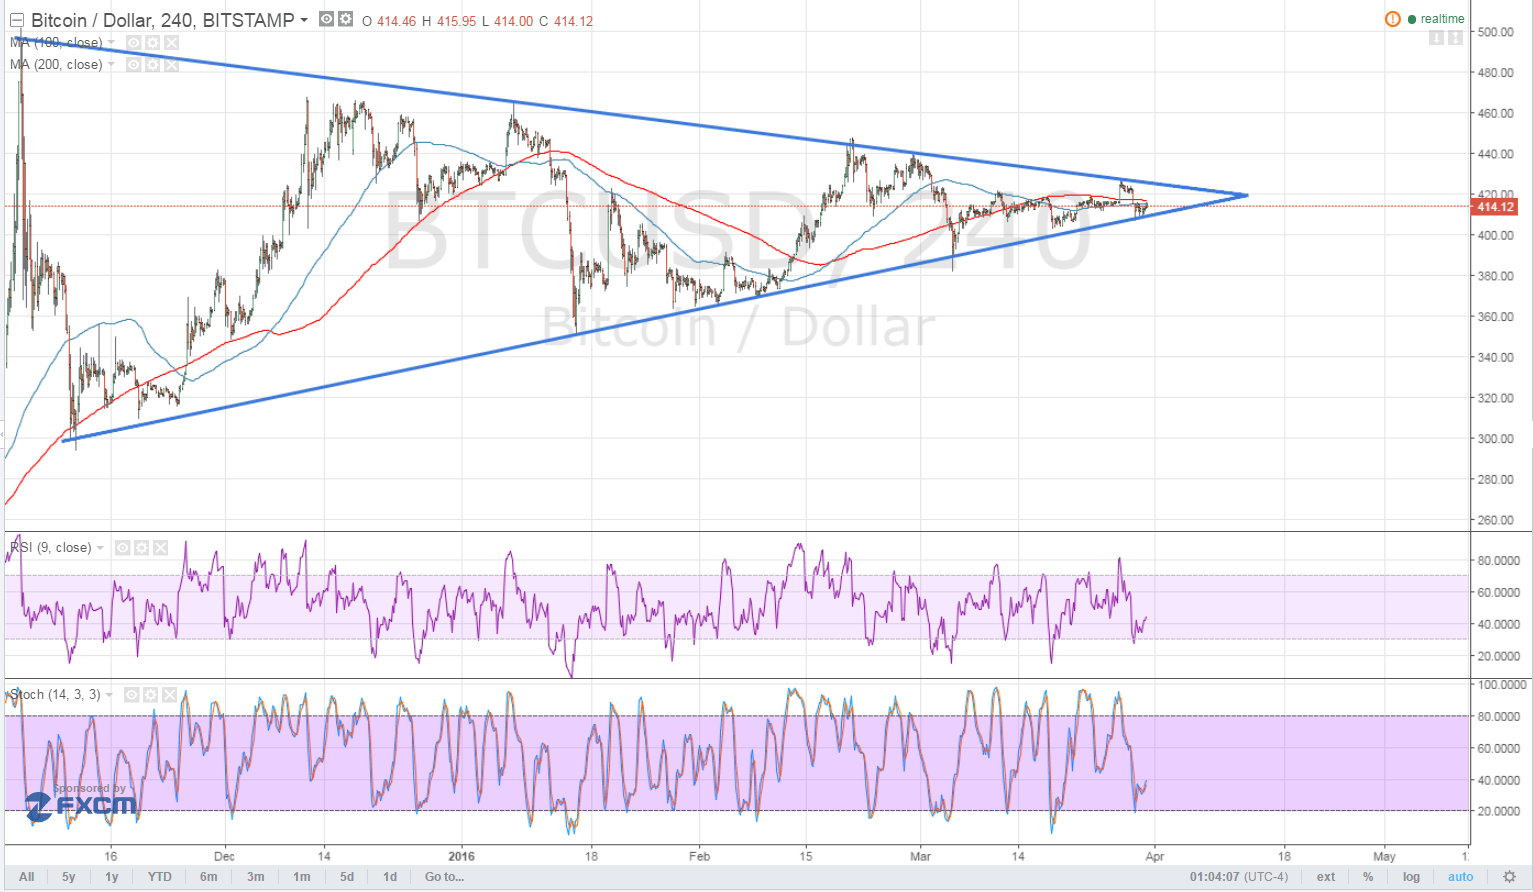

The 100 SMA is below the 200 SMA so the path of least resistance is to the downside. However, an upward crossover appears to be brewing and the indicators could keep oscillating, indicating that consolidation might continue.
RSI is on the move up, confirming that buyers are trying to regain control and push bitcoin price up to the triangle resistance around $420-430. Stochastic is also pointing up to indicate that buying pressure is resuming. If buyers are strong enough, they could even push for an upside breakout and a longer-term climb for bitcoin price.
On the other hand, a downside break below support could spur a prolonged downtrend, likely taking bitcoin price down to the next support at $380-400. Increased bearish pressure could even lead to a test of the major support at $300.
Market Events
The upcoming NFP release from the US economy on Friday could be a major catalyst for a move, as stronger than expected data could renew demand for the dollar. Recall that the US currency lost some of its appeal after Fed Chairperson Yellen reiterated their plans to keep borrowing costs low for much longer.
Another factor that could spur a big move is the Chinese PMI also due on Friday. Stronger than expected readings could reinforce risk appetite and buoy bitcoin price higher while weak results could lead to a flight to safety towards the lower-yielding US dollar.
Intraday support level – $400
Intraday resistance level – $430
Charts from Bitstamp, courtesy of TradingView