

Bitcoin Price Key Highlights
- Bitcoin price is back in consolidation after experience a surge in volatility in the past week.
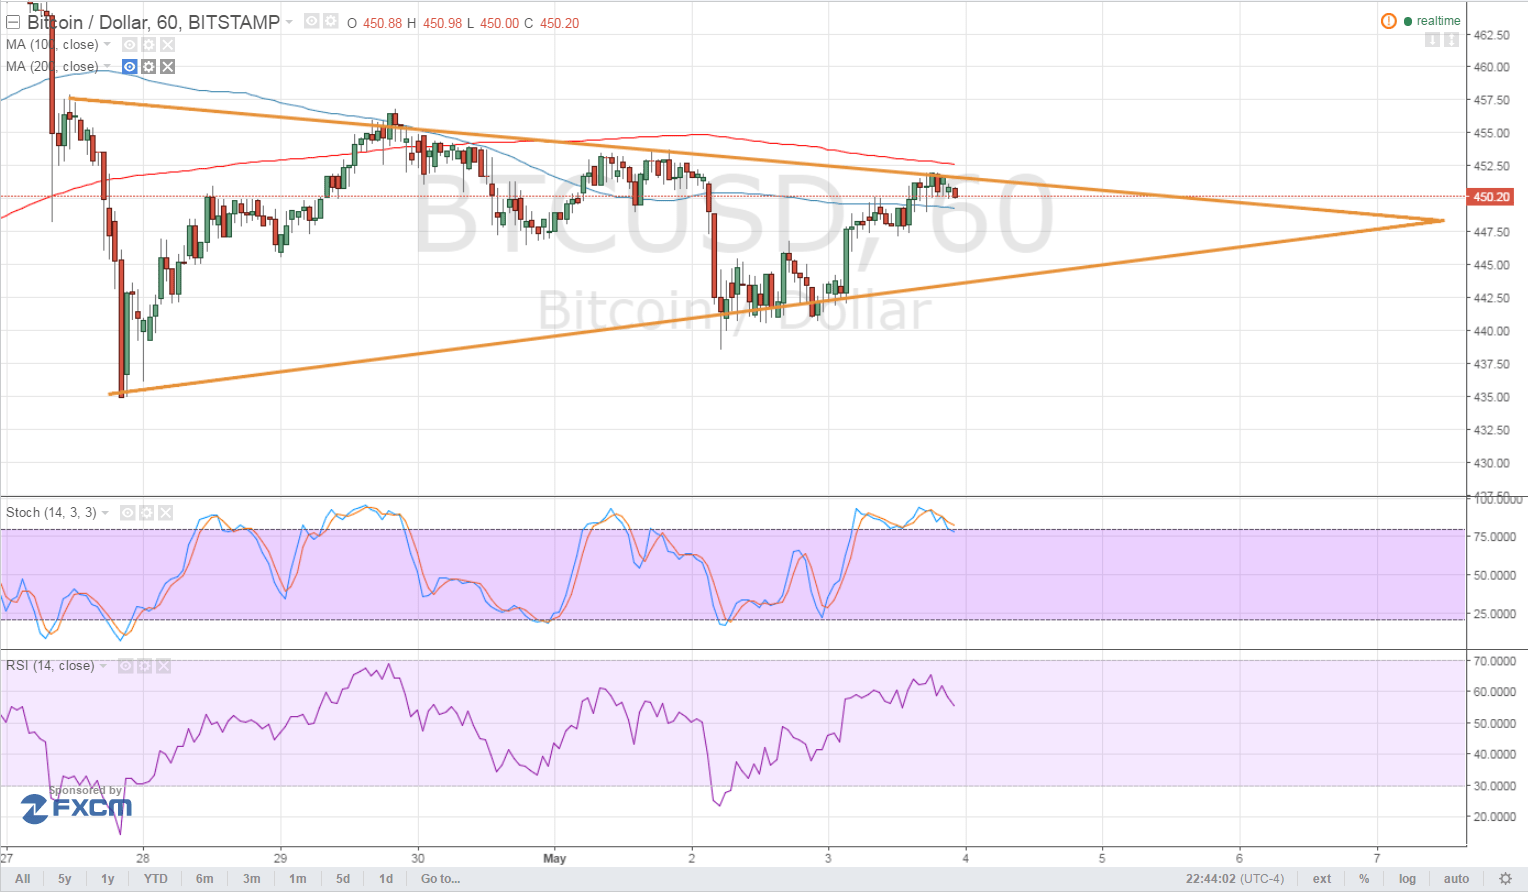
- Price formed higher lows and lower highs, creating a symmetrical triangle on its 1-hour time frame.
- Price is currently testing the triangle resistance and might be due for a selloff.
Bitcoin price is moving inside a symmetrical triangle consolidation pattern and is hovering around the top of the formation.
Technical Indicators Settings
The 100 SMA is below the longer-term 200 SMA so the path of least resistance is to the downside, confirming that the resistance might hold. In addition, the moving averages line up with the top of the triangle, adding to its strength as a ceiling for bitcoin price rallies.
Stochastic is indicating overbought conditions and is turning lower, suggesting that bearish pressure could come back in play. A bit of bearish divergence can be seen, as bitcoin price made lower highs while stochastic had higher highs. Similarly RSI is turning down from the overbought zone to show a return in selling momentum.
In that case, price could head back to the triangle support around $445. Stronger selling pressure could trigger yet another downside break, especially since bitcoin is pausing from a previous drop.

Market Events
The lack of top-tier events recently explains the current consolidation in bitcoin. There have been no major reports out of the US economy, leaving traders to price in expectations ahead of the employment report due on Friday.
A 206K gain in hiring is eyed, slightly weaker than the previous 215K increase. Weaker than expected data could result to a dollar selloff against bitcoin price since this would remind traders that the Fed isn’t likely to increase interest rates in June. Besides, an FOMC official pointed out that they might sit on their hands since the meeting would take place ahead of the Brexit referendum.
Still, risk-off moves stemming from downbeat Chinese PMI and the RBA rate cut could dampen demand for higher-yielding assets like bitcoin, possibly leading to a test of the triangle support for now.
Charts from Bitstamp, courtesy of TradingView