

Bitcoin Price Key Highlights
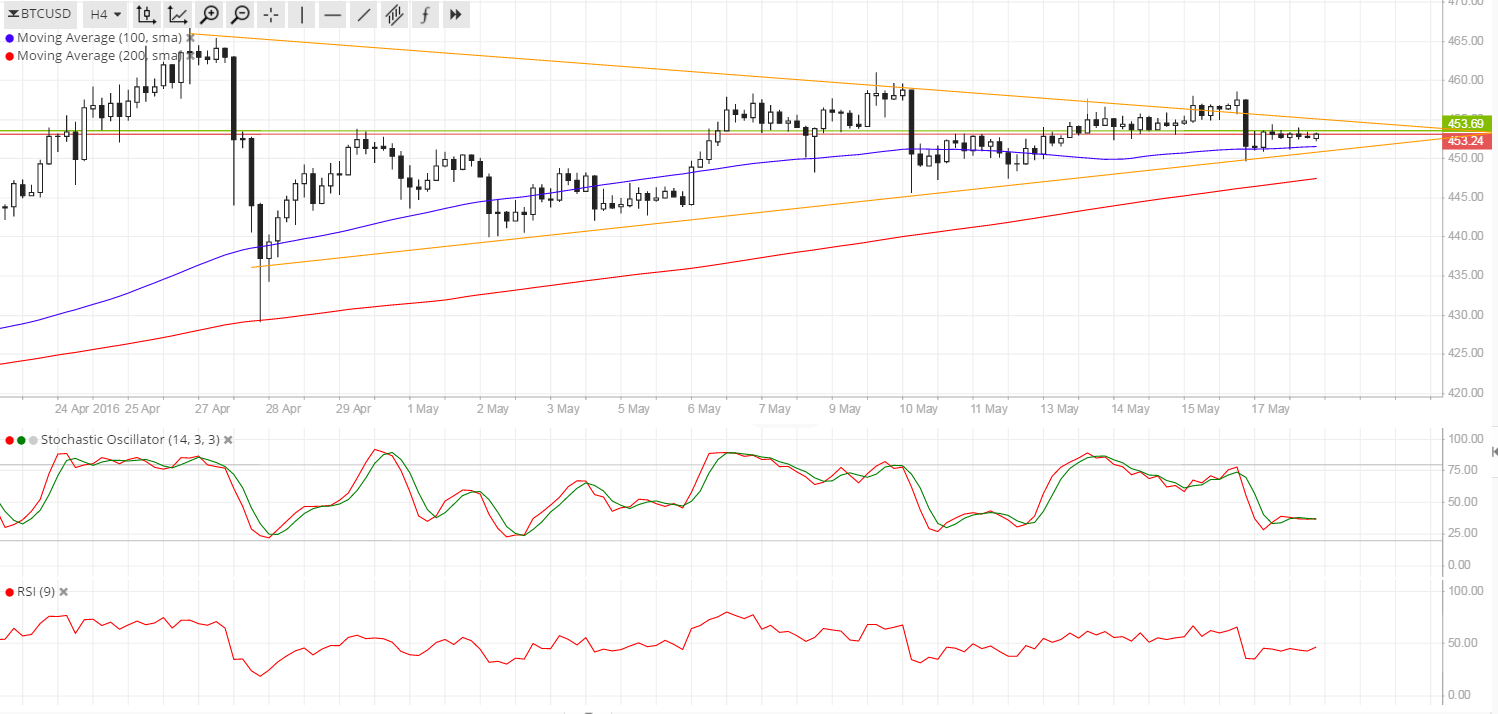
- Bitcoin price is still stuck inside its symmetrical triangle consolidation pattern on the 4-hour time frame.
- Price is hovering close to the support around $450 for now, still deciding whether to make a bounce or break.
- A bounce could lead to a test of resistance at $455 while a breakdown could trigger a longer-term downtrend for bitcoin.
Bitcoin price could be due for a triangle breakout this week as there are top-tier catalysts on deck.
Technical Indicators Signals
The 100 SMA is above the 200 SMA on the 4-hour time frame so a bounce seems more likely. However, the gap between the moving averages is narrowing so a downward crossover could be seen, likely spurring a surge in bearish momentum soon.
Stochastic is on its way down but is currently turning around, possibly indicating a return in buying pressure. RSI is also on middle ground, barely offering strong directional clues at the moment.
A break below the triangle support could lead to a drop towards the triangle lows near $430. On the other hand, rally past the triangle resistance could lead to another test of the longer-term ceiling at $470.

Market Events
Data from the US economy came in mostly stronger than expected yesterday, keeping the dollar supported against bitcoin price. Headline CPI rose 0.4% versus the expected 0.3% gain while the core CPI posted the estimated 0.2% uptick. Industrial production beat expectations with a 0.7% increase.
The FOMC minutes could prove to be a strong catalyst for bitcoin price action in today’s US trading session. In their actual statement, the Fed decided to keep rates unchanged and provide no clues about their next policy moves, keeping the dollar’s gains in check.
However, testimonies from a number of Fed officials recently reflected optimism among some policymakers, keeping speculations of a June hike in play. Additional hawkish remarks in today’s release of the meeting minutes could add more fuel to the dollar’s climb, possibly leading to a downside triangle breakout for bitcoin price. Cautious comments, on the other hand, could lead to more dollar losses and an upside break for bitcoin.
Charts from SimpleFX
Image NewsBTC