

Bitcoin Price Key Highlights
- Bitcoin price made a sharp upside breakout from its long-term consolidation pattern, signaling that further gains are in the cards.
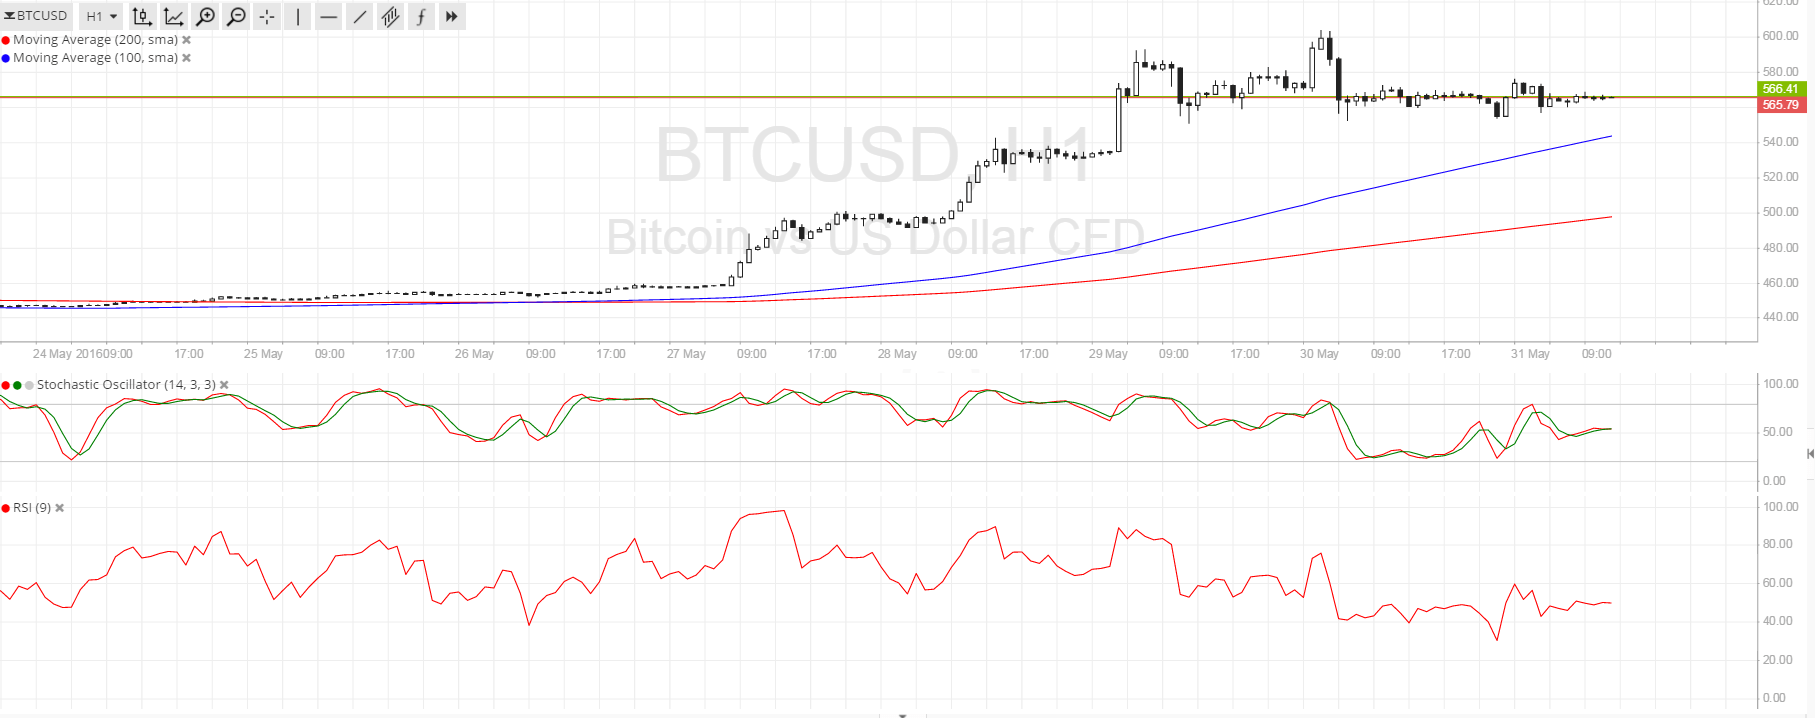
- Price is consolidating above the $565 level for now while bulls are trying to gather more steam.
- A correction or a continuation from the bullish run could take place from here.
Bitcoin price is pausing from its recent sharp climb, an indication that bulls are waiting for more signals to head higher.
Technical Indicators Signals
The 100 SMA is above the 200 SMA so the path of least resistance is still to the upside. The gap between the moving averages is widening so bulls are gaining more energy. For now, there are enough buyers located around the $565 level which is currently holding as near-term support.
A long green candle closing past the $600 mark could confirm that more buyers have joined the mix and are ready to push bitcoin price higher. The breakout was spurred by more Chinese traders putting money in the cryptocurrency as the government moves to weaken the yuan and impose capital controls.
Stochastic is treading lower, suggesting that profit-taking could be due. RSI is also heading south so bitcoin price could follow suit. A larger pullback could last until the previous year highs around $500.

Market Events
US dollars were out on a Memorial Day holiday yesterday, which explains the lack of direction for bitcoin price then. The return of traders could inspire more volatility and perhaps a breakout from the current consolidation.
Keep in mind that the dollar has regained ground against other fiat currencies on stronger speculations of a Fed rate hike in June or July, although the longer-term trend could still hinge on whether or not economic data supports this bias. The US non-farm payrolls is due on Friday and traders are on the lookout for signs of stronger wage growth which could reinforce rate hike bets.
Weak US data, on the other hand, could keep investors flocking to higher-yielding assets like bitcoin in anticipation of a prolonged period of low borrowing costs. Also, downbeat PMI data from China could convince investors to move more funds away from Chinese assets onto bitcoin.
Charts from SimpleFX
Header Image NewsBTC