Bitcoin Price Key Highlights
- Bitcoin price recently made a strong rally but it looks like bulls are booking profits.
- This could offer a nice opportunity to enter on a short-term correction from the sharp climb.
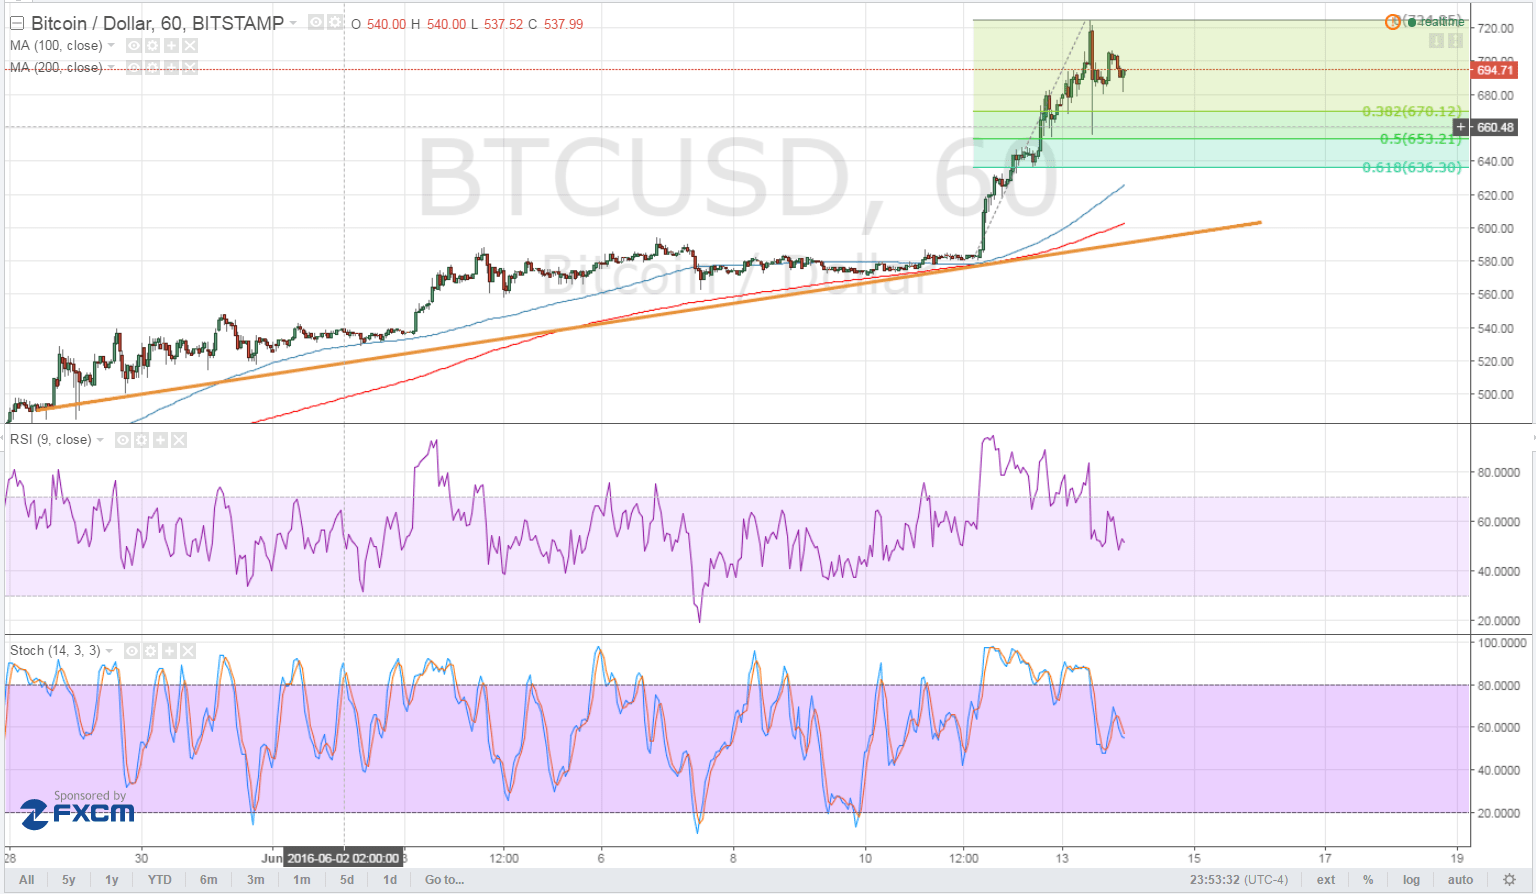
- Using the Fibonacci retracement tool on the latest swing low and high on the 1-hour time frame shows potential entry points.
Bitcoin price looks ready to make a correction from its recent rally, giving buyers a chance to hop in the uptrend at better levels.
Technical Indicators Signals
The 100 SMA is above the longer-term 200 SMA so the path of least resistance is to the upside. In addition, the gap between the moving averages is widening, which means that bullish momentum is getting stronger.
The Fib tool applied on the latest bitcoin price surge reveals that the 38.2% level coincides with the spike lower around $670. A larger pullback could last until the 50% to 61.8% Fib levels, which are around $635 to $650, while a huge correction could lead to a drop to the rising trend line closer to $600. This might be the line in the sand for any retracement, as a break below the trend line could constitute the start of a reversal.
RSI is on the move down, indicating that sellers are regaining control of price action. Similarly, stochastic is moving south so bitcoin price could follow suit. If any of the Fib levels hold as support, another move towards the previous highs at $720 could take place.

Market Events
The volatility and uncertainty in the financial markets these days are working in favor of bitcoin price, as the virtual currency is able to attract investors who are moving money away from fiat currencies and equities.
Central bank events this week could lead to sharp moves among major currencies so it’s understandable why traders are seeking alternative investments. In addition, the risk-off flows stemming from the upcoming EU referendum are also supporting bitcoin and other altcoins at the moment, a phenomenon that could carry on until the actual Brexit vote on June 23.
Keep in mind that brokers are introducing additional margin restrictions ahead of the referendum so another bitcoin price rally might be possible before the end of this week.
Charts from TradingView