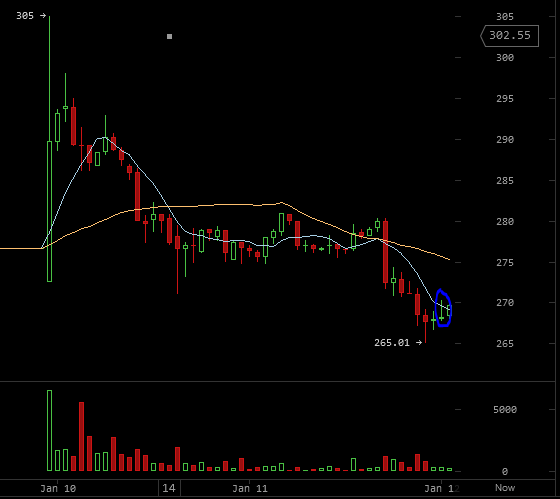
The market drove the price of Bitcoin downwards yesterday, until it touched the $265 line and then started rising until reaching $270 at the time of writing of this article.
By drawing a trend line with between the high reached on the 12th of November, 2011 ($432) and the low reached on the 4th of January ($257) and plotting Fibonacci retracements on the below chart, we can conclude the following:
- If the price fell below $255 which is the support point and the low reached on the 4th of January, the market is likely to drive the price to decline even more to $201, which is the next support point, according to historical charts.
- If the price cannot break the $255 support point and rises up, it will face resistance at $298, which is the 23.6% point according to the Fibonacci retracements. If the market’s buying power is strong enough to break the resistance at $298, it is likely to continue rising until reaching resistance at $324, which is the 38.2% point, according to the Fibonacci retracements, we plotted earlier
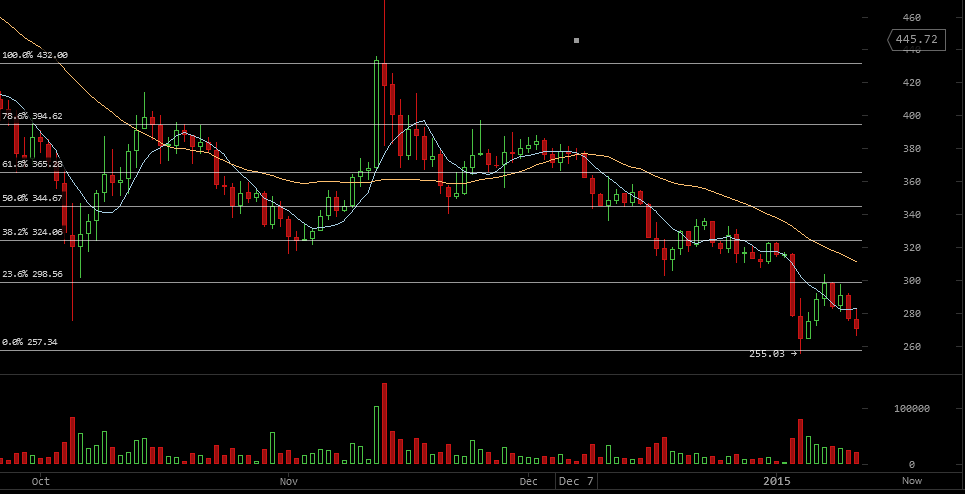
The volatility is now very high, and the price is likely to move sideways to the $255, before heading downwards, or going upwards. So, it is advisable to remain cautious and limit long positions, until the resistance at $298 is tested. The “shooting star” (blue circle on the above chart) might mean that the price is facing resistance and is more likely to continue falling.