

Bitcoin Price Key Highlights
- Bitcoin price broke below the short-term triangle consolidation pattern as predicted in the previous update.
- Price is currently stalling at an area of interest around $440 but could be due for further downside.
- The rising trend line connecting the lows of price action on the 4-hour time frame is still intact and might be the next floor.
Bitcoin price is headed for downside after its recent triangle breakdown, with bears eyeing support at the rising trend line.
Technical Indicators Signals
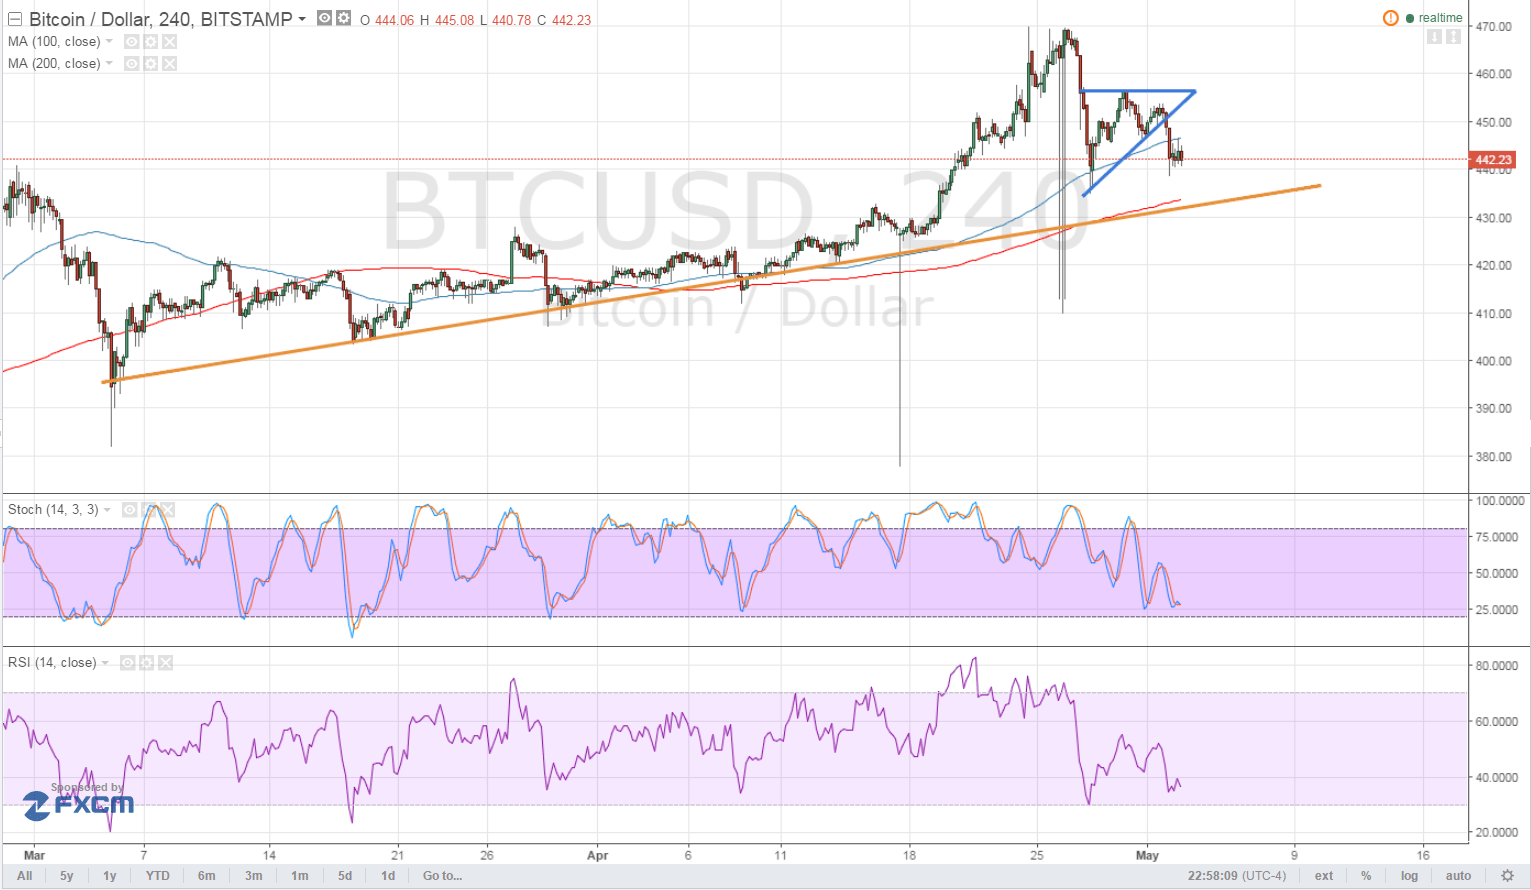
The 100 SMA is still above the longer-term 200 SMA so the path of least resistance is to the upside. However, bitcoin price has broken below the short-term moving average, hinting that a reversal may be in order. The 200 SMA is in line with the rising trend line connecting the lows, adding to its strength as a potential support zone.
Stochastic is on the move down so bitcoin price could follow suit. The oscillator is nearing the oversold area so bears might need to take it easy and let buyers take over soon. RSI appears to be turning higher to indicate a return in bullish pressure, possibly leading to a retest of the broken triangle support at $450.
A break below the trend line support could lead to a drop to the next area of interest at $430, then at $400 and $380. Strong bullish momentum, on the other hand, could spur a move up to the latest highs at $470.

Market Events
Data from the US economy was weaker than expected, as the ISM manufacturing PMI showed a sharper slowdown in expansion. However, the dollar managed to hold on to its gains against bitcoin price as risk aversion seemed to be in play.
There are no major reports lined up from the US economy today, leaving traders to price in expectations for the upcoming NFP release on Friday. Strong jobs growth could renew calls for a June rate hike, likely supporting the dollar against bitcoin, while weak results could spur stronger demand for the cryptocurrency.
Charts from Bitstamp, courtesy of TradingView