

Bitcoin Price Key Highlights
- Bitcoin price is still safely inside its ascending triangle pattern visible on the 4-hour time frame, suggesting that further consolidation could be seen.
- Price is now testing support at the bottom of the triangle around $445 and might be due for either a bounce or a break.
- If a downside break occurs, a longer-term selloff could ensue for bitcoin price. On the other hand, a bounce could lead to a rally up to the triangle resistance at $465.
Bitcoin price is sitting at the bottom of the long-term ascending triangle, still deciding whether to make a bounce or a break.
Clues from Technical Indicators
To figure out where bitcoin price could be headed next, let’s turn to the technical indicators. The moving averages are showing a downward crossover at the moment, with the shorter-term 100 SMA below the longer-term 200 SMA. This indicates that the path of least resistance might be to the downside, favoring further losses.
If a break below the triangle support is seen, bitcoin price could make it all the way down to the area of interest just above the $400 psychological support level. Stronger bearish pressure could even push it down to the bottom of the triangle near $350.
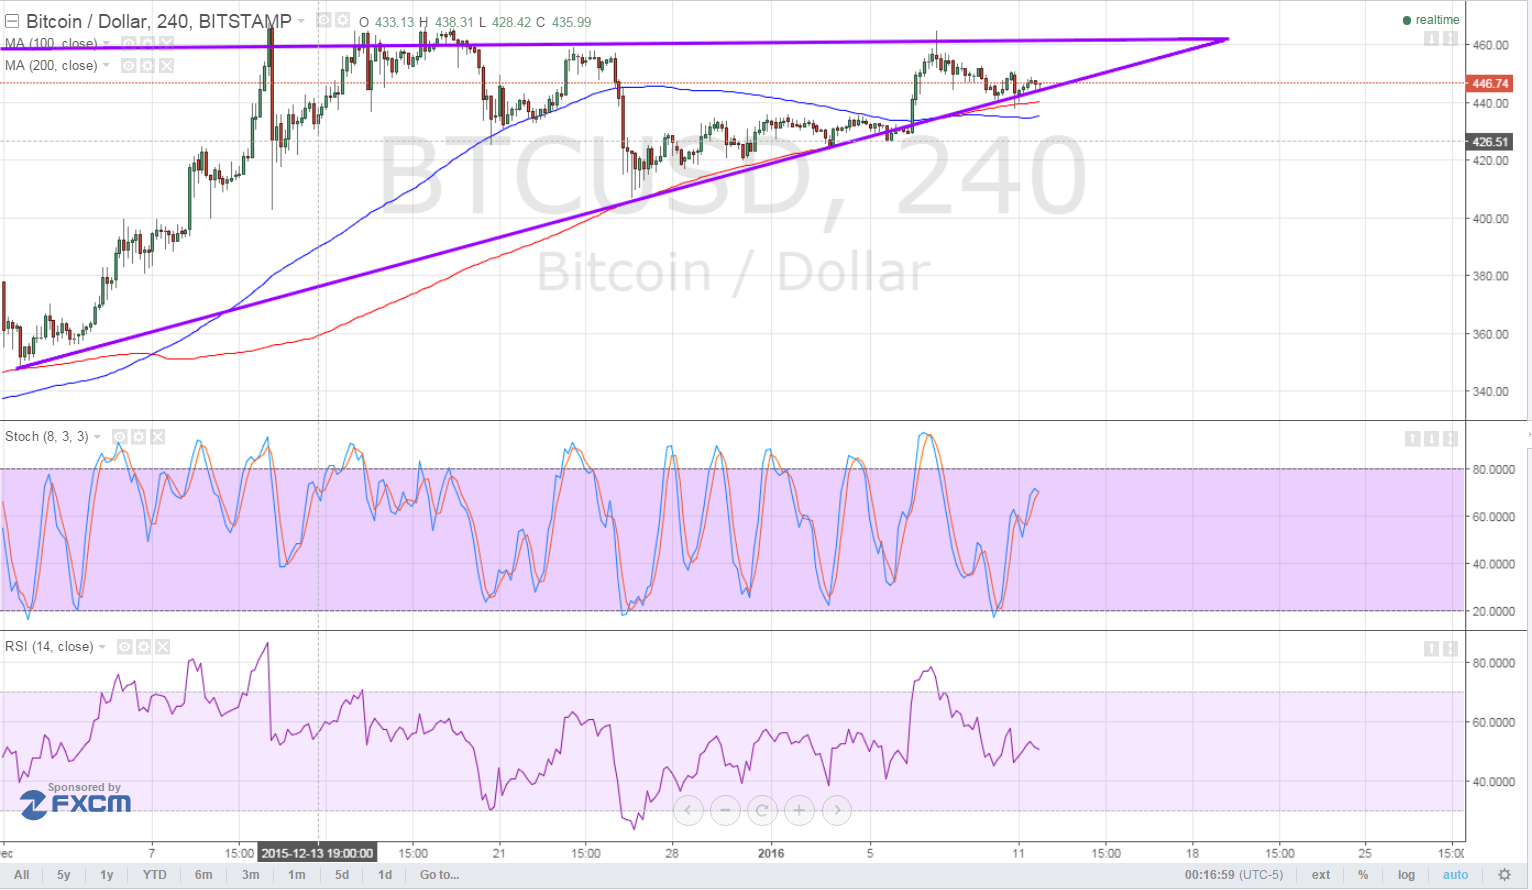

RSI is also on the move down, confirming that sellers are currently in control of bitcoin price action. Once this oscillator reaches the oversold zone, buyers might be able to take over and trigger a quick bounce or some profit-taking action.
Meanwhile, stochastic is on the move up, indicating that buying momentum is taking hold. This could still be enough reason for bitcoin price to bounce up to the top of the triangle, especially since the 200 SMA appears to be holding as a dynamic support level at the moment.
Market Sentiment Outlook
Much of bitcoin price action has been driven by USD flows these days, as the dollar has been acting as a safe-haven in times of market risk aversion. Last week, the stock market selloff in China has spurred strong dollar demand, with investors moving their funds out of higher-yielding and riskier assets like bitcoin towards lower-yielding ones.
However, the recent move by the Chinese government to intervene in the currency market has forced the dollar to return some of its wins, allowing traders to take on more risk. In addition, cautious rhetoric from Fed officials like Dennis Lockhart has dampened dollar demand, as his remarks cast doubts on whether the Fed can be able to hike interest rates in March or not.
Moving forward, further consolidation seems to be likely for bitcoin price now that traders are still trying to make sense of the recent market rout and figure out if it marks the start of longer-term trends or a prevailing market theme. Additional risk-off flows could be the catalyst for a downside triangle breakout while a recovery in risk appetite could keep the cryptocurrency supported.
Intraday support level – $445
Intraday resistance level – $465
Technical Indicators Settings:
- 100 SMA and 200 SMA
- Stochastic (8, 3, 3)
- RSI (14)
Charts from Bitstamp, courtesy of TradingView