

Bitcoin Price Key Highlights
- As hinted in yesterday’s update, bitcoin price was due for a downside break of the triangle support visible on the 4-hour time frame.
- Price had been previously consolidating inside a long-term ascending triangle after forming higher lows and testing resistance at $465.
- With this downside break, bitcoin price could eventually make its way towards the $400 area of interest.
Bitcoin price could undergo stronger bearish momentum in the coming days after it broke below the ascending triangle support.
How Low Can It Go?
The triangle chart pattern spans $350 to $465 so the resulting breakdown could last by the same amount, although there are near-term support areas visible. The short-term 100 SMA is currently holding as a dynamic support level but it is below the longer-term 200 SMA so the path of least resistance is to the downside.
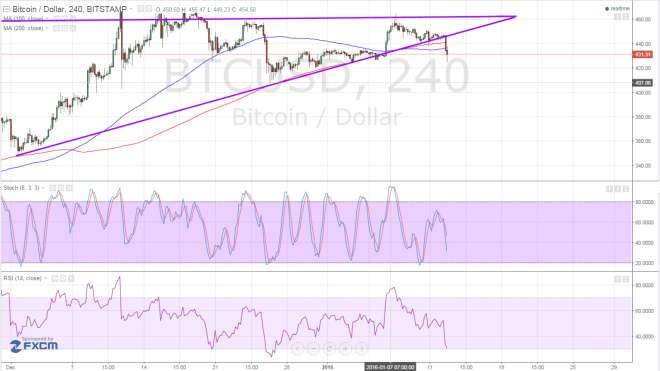

Stochastic is on the move down, confirming that sellers are taking control and ready to push bitcoin price further south. RSI is also moving lower but is already near the oversold region, which means that bearish momentum could fade soon.
If so, a pullback opportunity to the bottom of the triangle around $450 could emerge, allowing more sellers to enter at a slightly better price. A larger correction could place bitcoin price back inside the triangle and on the way to test the resistance once more.
If this move proves to be a fakeout, bulls could gain more traction in pushing bitcoin price back above the triangle resistance and onto the previous year highs closer to $500. However, market sentiment is suggesting that the dollar is enjoying more support.
Should the moving averages move further apart, bearish momentum could pickup. This could trigger sharper drops to the next areas of interest to $420, $400, then all the way down to $350.
Bitcoin vs. USD
Apart from the risk aversion that ensued at the start of the year, the U.S. dollar is also drawing support from stronger fundamentals. The latest NFP figure beat expectations and reflected continued progress in the labor market, although wage growth remained subdued.
Event risks for the dollar moves this week include the retail sales release, PPI figures, and consumer sentiment index due on Friday. This should give more insight on the consumer sector and future inflation trends, two factors that also impact Fed policy.
Consumer spending might print strong figures for December, as holiday shopping sprees are likely to add seasonal purchases to the numbers. However, the PPI readings could be of more interest, as some Fed officials have highlighted the importance of their inflation outlook in determining whether they’re likely to hike interest rates again in March or not.
As for bitcoin, the cryptocurrency appears to be joining its riskier peers in tumbling during risk-off days. After all, investors feel better about putting their money in safer and lower-yielding assets during these instances. In the virtual currency arena, though, bitcoin remains supported compared to the rest of the bunch.
Intraday support level – $400
Intraday resistance level – $450
Technical Indicators Settings:
- 100 SMA and 200 SMA
- Stochastic (8, 3, 3)
- RSI (14)
Charts from Bitstamp, courtesy of TradingView