Bitcoin Price Key Highlights
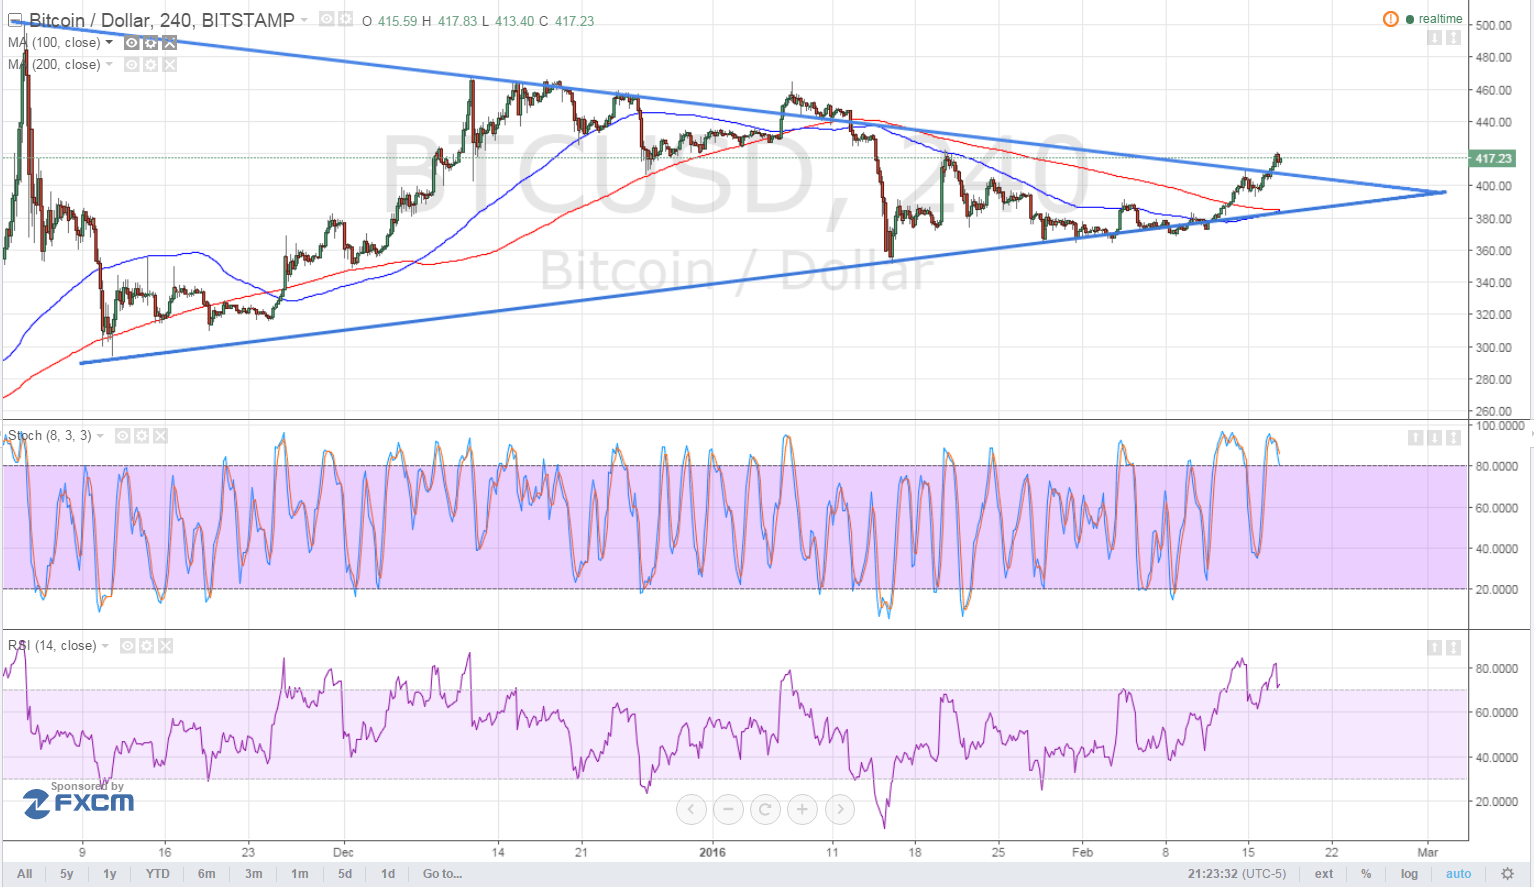
- Bitcoin price previous traded inside a symmetrical triangle pattern on the longer-term time frames, forming higher lows and lower highs since November last year.
- Price just closed past the triangle resistance around $410 and might have its sights set on more gains.
- Technical indicators, however, are still suggesting a potential weakening of buying momentum.
Bitcoin price could be on track to test its previous year highs at $500 now break from the triangle consolidation pattern took place.
Technical Indicators Signals
So far, technical indicators don’t seem to have caught up with the sudden upside break yet, although the moving averages are edging closer to make a potential upward crossover. For now, the 100 SMA is still below the 200 SMA and is close to the triangle support at $360.
Meanwhile, stochastic is indicating overbought conditions at the 80.0 level and is starting to turn lower, suggesting that selling pressure might pick up. Similarly, RSI is turning down from the overbought region, hinting at a possible return in bearish momentum.
In that case, bitcoin price could still pull back to the triangle resistance, which might now hold as near-term support. If price breaks below this area, though, it might still find a floor at the $360 triangle support to carry on with the consolidation.

Market Events
The release of the FOMC minutes and the simultaneous pickup in risk appetite weighed on the US dollar in recent trading sessions. As expected, Fed officials highlighted the increased downside risks to growth and inflation but maintained that a couple more rate hikes might be possible this year. FOMC members also clarified that the US economy is still on track to achieve its 2% inflation target.
Meanwhile, commodity prices have been on the rise, led by crude oil in hopes that the top oil-producing nations could reach an accord. Energy ministers from OPEC and non-OPEC nations have been busy discussing a possible production freeze, although some countries seem hesitant to participate.
Still, this attempt to coordinate a plan to stabilize the oil market has proven positive for risk, lifting higher-yielding assets and bitcoin price along the way. Any indication that an agreement is about to be made could allow bitcoin to sustain its climb all the way up to the previous year high at $500 and beyond.
No other major catalysts are lined up for the US dollar for the rest of this trading week, which suggests that market sentiment could be mostly responsible for bitcoin price action throughout. However, since the halfway point of the week has passed, the opportunity for profit-taking before the weekend emerges once more.
This profit-taking activity could trigger reversals or corrections for the strong moves seen earlier in the week, particularly for bitcoin price which has been climbing nonstop. A quick pullback could take it back to the triangle resistance, with another likely bounce waiting in the wings for next week.
Intraday support level – $410
Intraday resistance level – $450
Technical Indicators Settings:
- 100 SMA and 200 SMA
- RSI (14)
- Stochastic (8, 3, 3)
Charts from Bitstamp, courtesy of TradingView