Bitcoin Price Key Highlights
- Bitcoin price has been trending higher, following an upside breakout from a long-term triangle consolidation pattern.
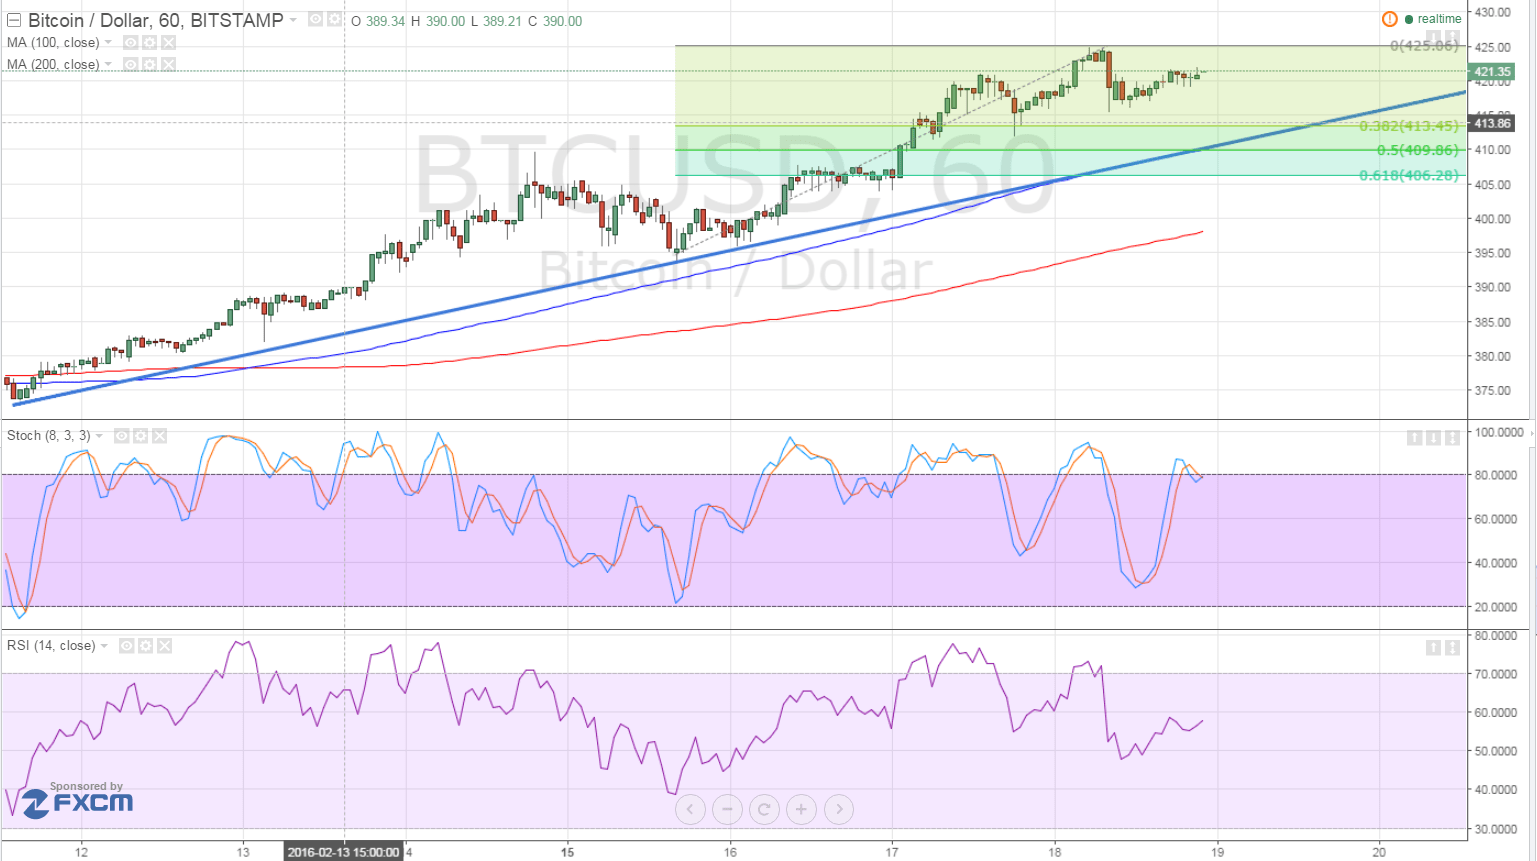
- Price is starting to trade above a rising trend line visible on the 1-hour time frame.
- Price appears to be stalling around the $425 area, indicating that a pullback to the trend line might take place again.
Bitcoin price could draw support from the short-term rising trend line connecting the recent lows of price action before resuming its climb.
Potential Support Levels
Applying the Fibonacci retracement levels on the latest swing low and high shows that the 38.2% level is close to the trend line around the $413 area. A larger pullback could last until the 50% Fib at $410 or the 61.8% Fib at $405.
The 100 SMA lines up with the rising trend line and this might add to its strength as a potential support zone. In addition, this short-term MA is above the longer-term 200 SMA, confirming that the path of least resistance is to the upside and that the uptrend could carry on. Also, the moving averages are edging farther apart, reflecting a rise in bullish momentum.
Sustained buying pressure could even take bitcoin price past the previous highs of $425 onto the next resistance at $465 then onto last year’s highs at $500.
However, stochastic is already heading down from the overbought area, indicating that sellers may be taking control. If the selling pressure only lasts for the near-term, it might just be enough to trigger a quick correction to the Fib levels.
On the other hand, sustained selling momentum could spur a downside break of the trend line and start a selloff. In that case, bitcoin price might have its sights set on the next support around the 200 SMA or $400. RSI is on middle ground after coming from the overbought area but appears to be heading higher again. This indicates some degree of hesitation between buyers and sellers.

Market Events
Risk appetite has allowed bitcoin price to advance against the US dollar in the past few days but it looks like traders reduced their high-risk holdings yesterday. Market watchers are getting tired waiting for a coordinated attempt from OPEC and non-OPEC nations to curb production and lift prices, thereby resulting to commodity price declines and risk aversion yesterday.
Data from the US economy has also been mostly stronger than expected recently, reminding traders that the Fed is still likely to tighten monetary policy in a few more instances this year.
For today, CPI readings are due and stronger than expected results could mean more dollar gains against bitcoin price. The headline figure is expected to show another 0.1% drop while the core figure could print a 0.2% uptick.
Also, the possibility of profit-taking before the weekend could force bitcoin price to return some of its recent wins before resuming its climb next week. Reversal candlesticks around any of the Fib levels could signal a potential continuation of the uptrend later on while long red candles could reflect a large shift to risk aversion.
Charts from Bitstamp, courtesy of TradingView