We’ve been pushing higher and higher in our bitcoin price trading efforts over the last few days and we’re now heading into the close of the week, and things aren’t slowing down. Price remains strong and the bulls look firmly in control right now – something that (if it continues) should feed its own fire. Bulls buy, price rises, secondary bulls pile in, in an attempt to get on the upside bandwagon, price rises, etc. There’s the chance that at any time a wave of selling might initiate a correction, as traders take profits off the table, but we’ve been saying that for the last few days and – as yet – it’s not happened.
If (more likely when) it does, we’ll make sure we’re ready. Things aren’t going to turn around without us already having a range in place as and when they do, so we should be fine from an intraday perspective as far as both hedging against a short term decline and profiting from the move is concerned.
For today, then, let’s get these levels in place. As ever, get a quick look at the below bitcoin price chart so as to get an idea of the levels we are focusing on before things get moving. It’s a five-minute candlestick chart and it’s got our key range overlaid in green.
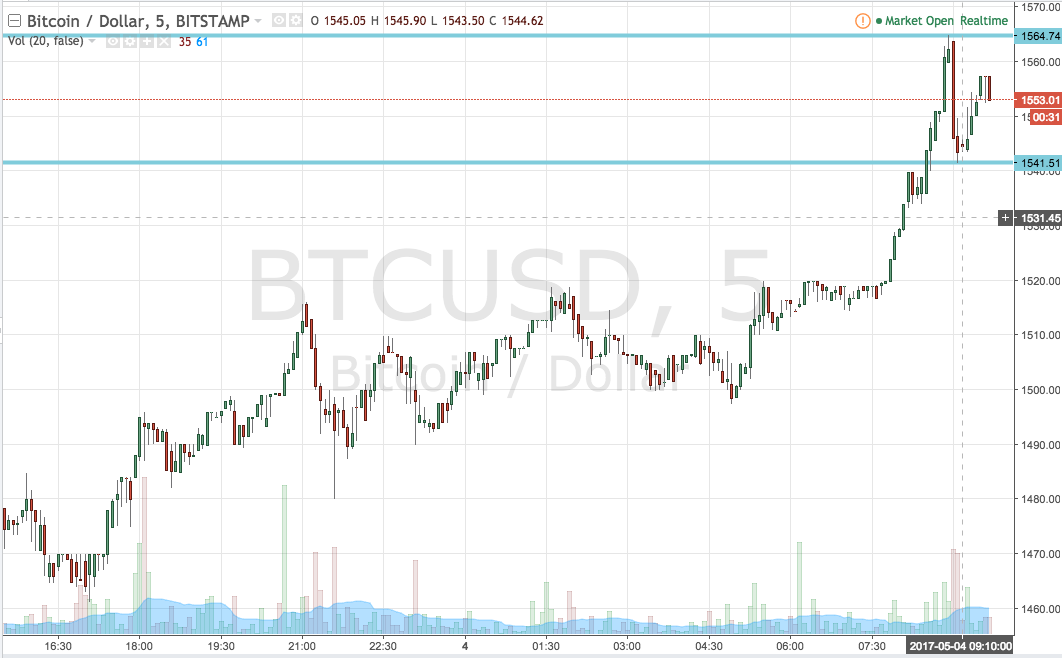

As the chart shows, the range we are looking at is defined by support to the downside at 1541 and resistance to the upside at 1564. Standard breakout strategy for the time being, so we’ll be looking at getting into a long entry towards an immediate upside target of 1580 if price breaks resistance, and conversely, a short trade towards a downside target of 1530 if we see a break (and a close) below support.
Stops just the other side of the entries will ensure we’re taken out of the position in the event of a bias reversal.
Charts courtesy of SimpleFX