We’re off to a fresh week of trading in the bitcoin price and a break of the $3000 level is looking more and more realistic. The weekend brought with it plenty of volatility and price is currently trading in and around the 2950 region. With a little pop from these levels, there’s plenty of opportunity for breakout runs and a break of the above mentioned key level. We’re not going to spend too much time looking at what happened over the weekend as things are moving pretty fast and we don’t want to miss out on an entry opportunity. So, with this noted, let’s get to the important stuff. As ever, take a quick look at the chart below before we get started. It’s a one-minute candlestick chart and it’s got our key range overlaid in blue.
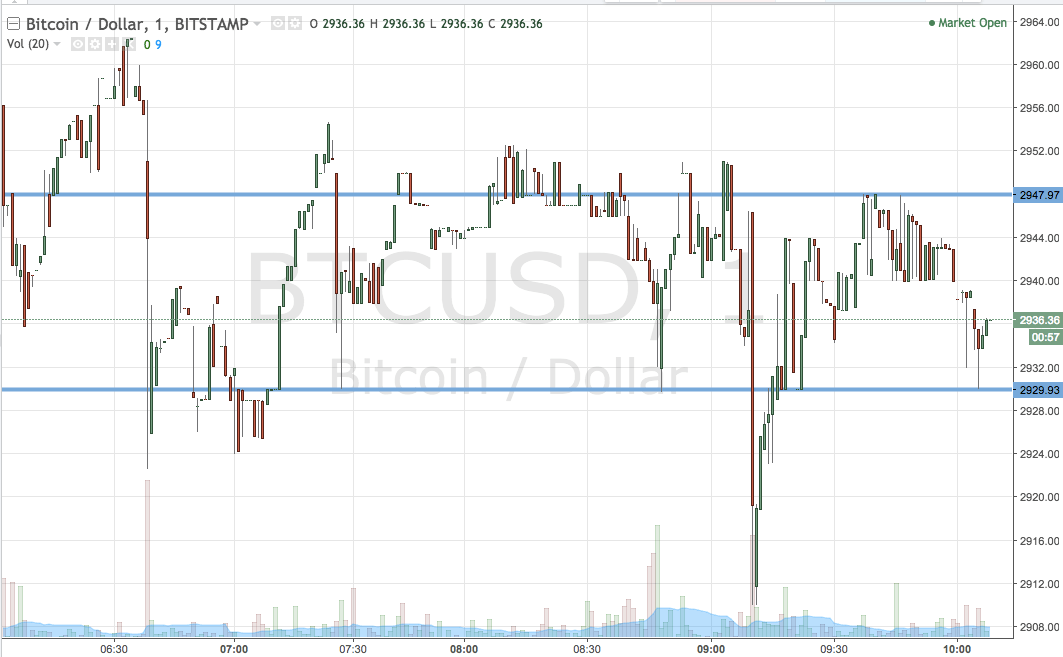

As the chart shows, then, the range we’ve got in our cross hairs is defined by support to the downside at 1929 and resistance to the upside at 2947. There’s just about enough room to go at things with an intrarange strategy, so we’ll be in long on a bounce from support towards a target of resistance and short on a correction from resistance towards a target of support.
If we see a break of resistance to the upside, we’ll look out for a close above the break to validate a long entry towards an immediate upside target of 2970. A stop on the trade somewhere in the region of 2940 will ensure we are taken out of the position in the event of a bias reversal.
Looking the other way, if we see a close below support, we’ll be in short towards a target of 2900 flat. Again we need a stop on the position and somewhere in the region of 2938 works well.
Let’s see how things play out.
Charts courtesy of Trading View