

Yet again, we’ve had a pretty eventful weekend in the bitcoin space. A host of fundamental developments towards the end of last week ended a period of relative quiet (at least from a volatility perspective) and translated to some piqued interest across the Saturday and Sunday sessions. Asian trading dominated the action, as illustrated by yuan trading volume, and the timing of the sharp moves, but as Europe took over this morning, the momentum continued, and it looks like we are going to have a busy week. It’s speculative, but it will be interesting to see if last night’s Super Bowl in the US will impact US volume today. There have been numerous occasions on which events such as this one have weighed on volume across the subsequent session in the more traditional financial asset markets, and today we get an opportunity to see whether the same phenomenon applies to digital currency. Interestingly, and as a bit of a side note, there is also another phenomenon that links the Super Bowl and the equities markets – well worth a read for those interested in that sort of thing. Anyway, getting back to bitcoin, action over the weekend reached highs of 380 flat before correcting towards373, and then once again reversing to levels just shy of these aforementioned highs. These two levels will play a part in today’s strategy, which we will get to shortly. Current price sits circa 375, which is mid range on today’s definitions. We’ve got a reasonably wide range to play with, so we’ll finally be able to bring our intrarange strategy back in to play (we’ve not been able to for the last week of so as a result of tight, coiling action) and we will take a traditional breakout approach to get in on any volatility outside of our range. So, with this said, what are we looking at from a target and risk perspective, and where are we looking to get in on any action? Take a quick look at the chart to get an idea of the key levels for today’s European and US sessions.
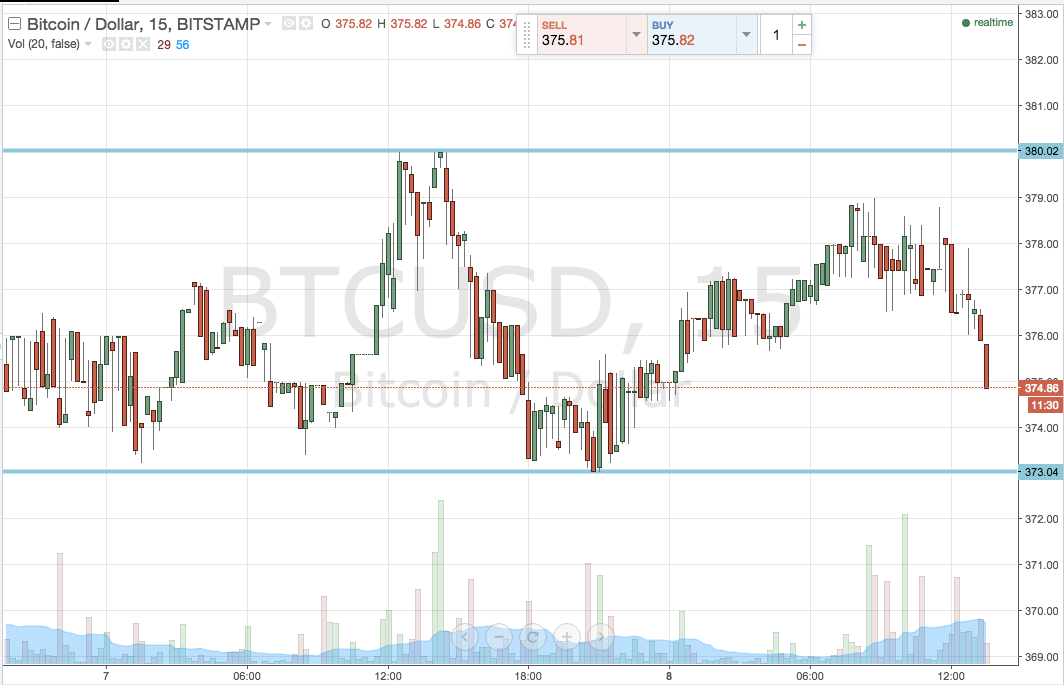

As the chart shows, the range for today is defined by the two levels we have already mentioned – in term support at 373 flat and in term resistance at 380 flat to the upside. We’re mid range at present, so let’s address the upside first.
If we get a break above in term resistance, we are going to watch for a close above this level to signal a long entry towards an upside target of 390 flat. It’s a pretty aggressive target, and gives us plenty of room for a wide stop – somewhere in the region of 376 works to keep this attractive on the risk management side of things.
Looking the other way, a close below in term support will put us short towards 365, with a stop at 375 defining our risk.
Intrarange, long at support and short at resistance, targeting the opposite boundary with a stop just the other side of the entry.
Charts courtesy of Trading View