Yesterday evening, we switched our bitcoin price trading strategy up a little and went with a classical charting pattern for our late night intraday trading. The pattern played out pretty much as we’d hoped initially, but reversed relatively quickly, and we got a spike to the downside early evening. Post-spike, however, price quickly recovered and ran up to overnight highs in and around 1470. We’re going to keep this latter level in mind as we move forward into the session this morning. From highs, price has edged down, and once again found a bottom and subsequently bounced. In other words, action is all over the place. This sort of up and down movement is always pretty good for us – we can jump in and out of the markets as and when price breaks, and pull quick easy profits from the action we see.
So the plan today is to continue this strategy heading forward.
With this noted, let’s get some key levels outlined for the session. Take a quick look at the chart below before we get to the details. As ever, it’s a five-minute candlestick chart and it’s got a range overlaid for the morning out of Europe.
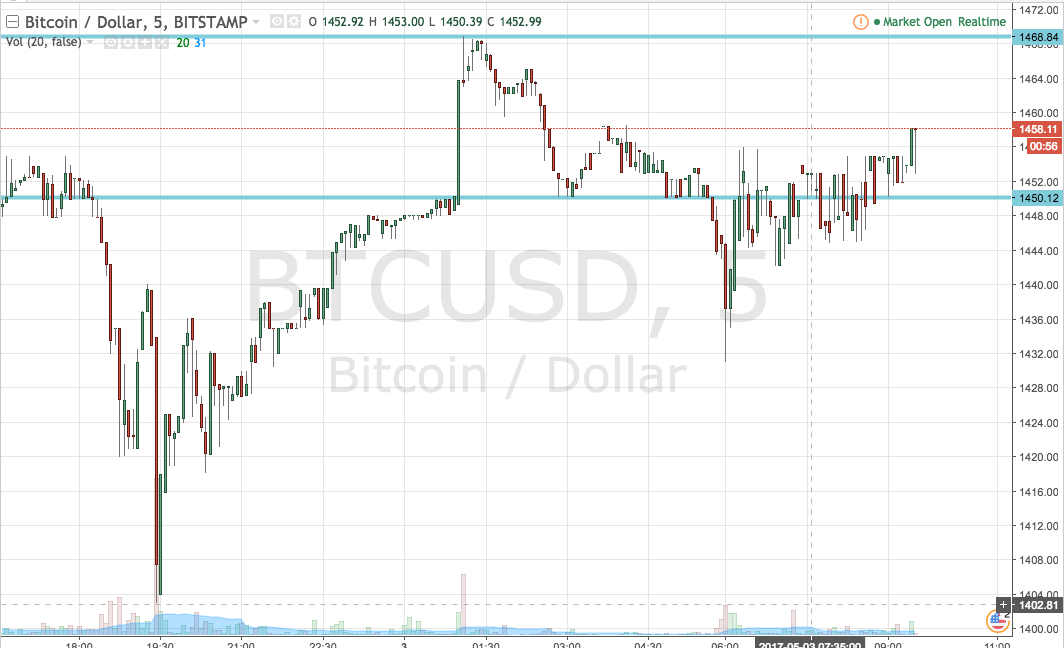

As the chart shows, then, the range we’ve got in our sights for the session this morning is defined by support to the downside at 1450 and resistance to the upside at 1468. That’s plenty of room for intrarange, so we’ll be getting in long on a bounce from support and short on a correction from resistance.
Looking at breakout, if we see a close above resistance, we’ll jump into the markets long towards an immediate upside target of 1480. A stop at 1464 defines risk. Looking the other way, a close below support is going to get us in short towards a downside target of 1440. A stop on this one somewhere in the region of 1452 looks good.
Charts courtesy of Trading View