And we’re off on another week of trading in the bitcoin price. Action over the weekend saw a continuation of the overarching upside momentum that’s brought the run we’ve seen over the last month and a bit and – with any luck – we’ll get a continuation of this sort of action as Monday matures and the US session gets underway a little later on.
As ever, while it would be nice to see such a continuation, we’ve got to keep in mind that there exists the near-term potential for a correction. If price does correct, we should be able to get into a downside entry and hedge any deprecation. That’s the goal, anyway.
So, with all this said, let’s get to the details.
Take a look at the chart below to get an idea of what’s on and where we are looking to get in and out of the markets according to the rules of our intraday strategy. It’s a five-minute candlestick chart and it’s got our key range overlaid in blue.
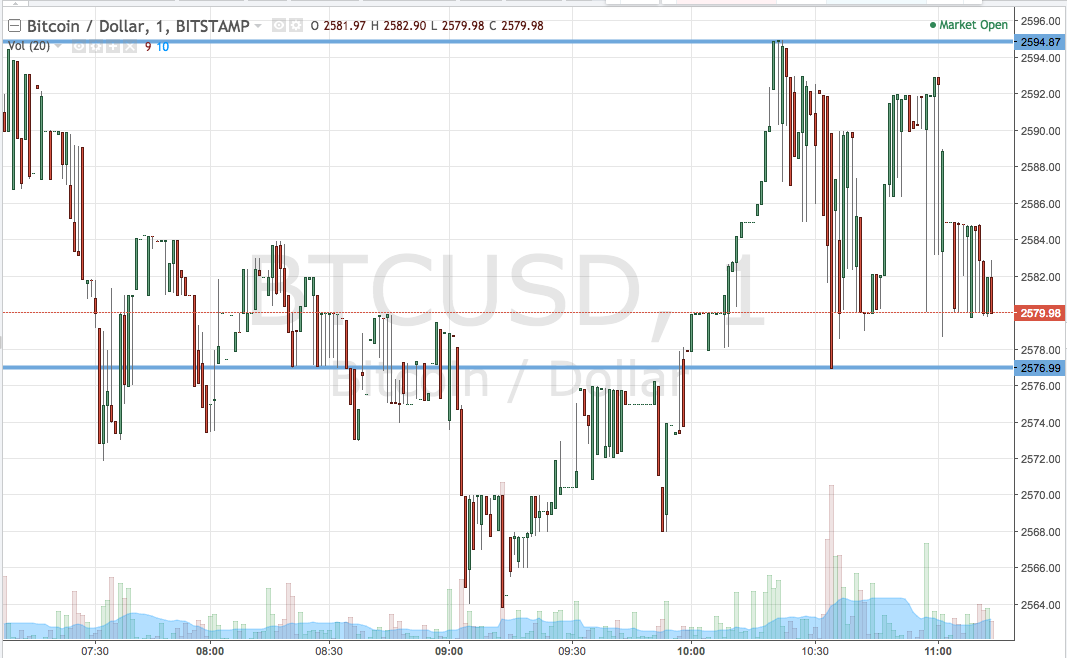

As the chart shows, then, the range we are looking at for the session today is defined by support to the downside at 2576 and resistance to the upside at 2594. We will initially be on the look out for a break above resistance. If we see the break, we will be on alert for a close above that level and – if we see the close – we’ll be in long towards an upside target somewhere in the region of 2630. A stop on the trade at 2584 looks good.
Looking the other way, we’re going to implement the same strategy but to the short side. So, if price closes below resistance, we’ll be in short towards 2560. A stop on this one at 2586 will ensure we are taken out of the position in the event of a bias reversal.
Charts courtesy of Trading View