There’s another day done out of Europe, and it’s not been particularly noteworthy. There’s a good chance now that we are going to see some degree of extended consolidation phase over the next few days. This flies in the face of what we outlined this morning – at that point we were coming off the back of a period of sustained volatility and it looked as though this volatility might carry through to the European afternoon. As it turns out, it didn’t carry through, and so we’ve had to alter our expectations.
So, as we move into the evening session out of Europe, and into the US session, let’s outline some key levels to take into the action we see tonight. As ever, take a look at the chart below to get an idea of what’s on, and what happened during the session today. As ever, it’s a five minute candlestick chart and it’s got our key levels overlaid in green.
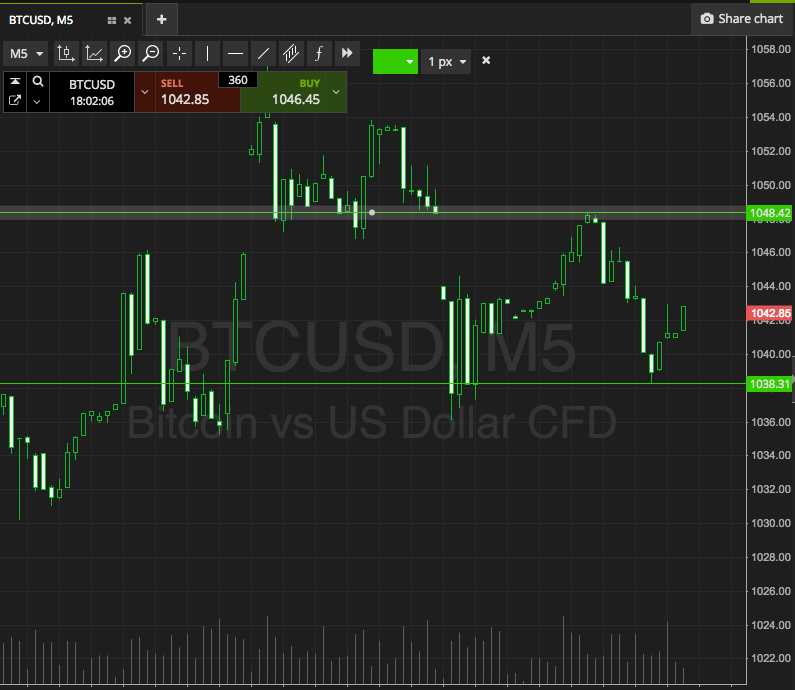

As the chart shows, the range in focus for this evening’s session is defined by support to the downside at 1038 and resistance to the upside at 1048. There’s just about enough room with a range like this to go at things with an intrarange strategy, so if we see a correction from resistance, we’ll get in short towards support, and if we see a bounce from support, we’ll be looking to get in long towards resistance.
From a breakout perspective, if price breaks through resistance, we’ll be getting in long towards an immediate upside target of 1058. A stop loss on the trade at 1045 defines risk nicely. Conversely, a close below support will put us in short towards a downside target of 1028. Again a stop loss is necessary, and somewhere in the region of 1041 looks good on this one.
Charts courtesy of SimpleFX