So here we are at the end of the week yet again and what a week we’ve had in our bitcoin price trading efforts. Things have moved incredibly fast across the sessions, weighted towards the crossover between the US and the European sessions primarily, This crossover is always a busy period in terms of volume, so that price moves substantially during said period is never too much of a surprise, but it’s always nice to have expectations validated, especially in this sort of (comparatively) immature market.
So, we’ve got a session left out of both Europe and the US before the week draws to a close and we head into the weekend and it’s time to get some levels outlined with which we can carry forward into the early European session today, and beyond into this evening.
Before we get to the detail, and as usual, take a quick look at the chart below to get an idea where things stand right now in the market (i.e. how action impacted the bitcoin price last night) and where we are looking at getting in and out of the markets according to the rules of our intraday strategy today.
It’s a one-minute candlestick chart and it’s got our key range overlaid in blue.
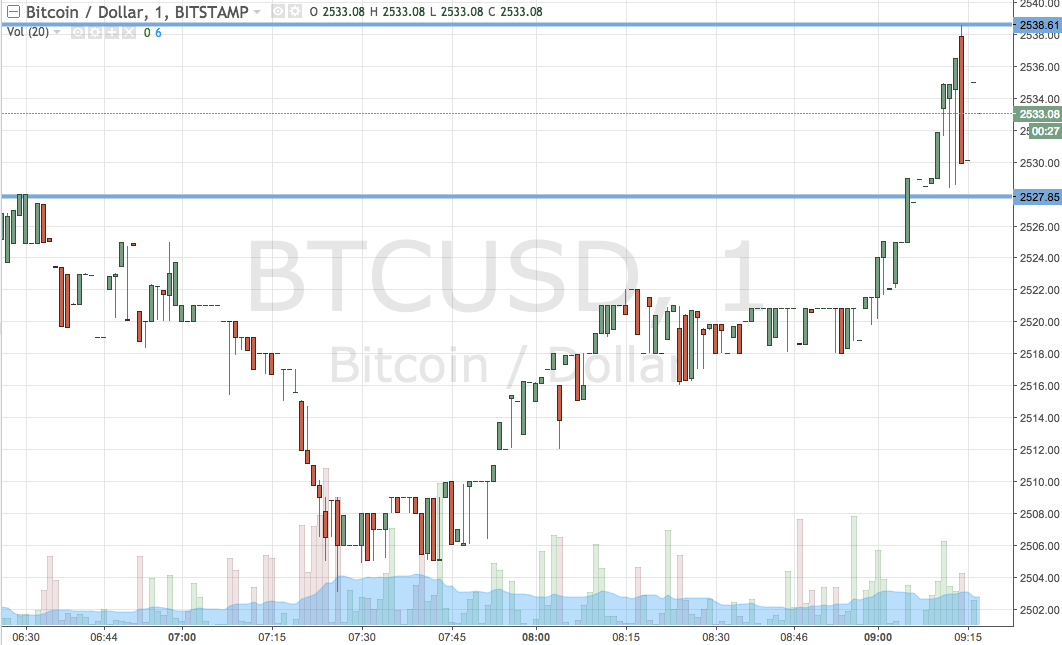

As the chart shows, the range we’ve got in our sights for the session today is defined by support to the downside at 2527 and resistance to the upside at 2538. We actually got a pretty nice upside break just a little earlier on this morning, so we’re hoping to see some degree of continuation on this break moving forward.
If we see price close above resistance, we will get in long towards an immediate upside target of 2560. Conversely, a close below support will have us in short towards 2500 flat.
Charts courtesy of Trading View