

- Bitcoin price dived with bearish moves and retested the key $3,540 support area against the US Dollar.
- There is a crucial declining channel in place with resistance at $3,585 on the hourly chart of the BTC/USD pair (data feed from Kraken).
- A break above the channel resistance and $3,600 could spark more upsides in the near term.
- On the downside, the main supports for buyers are near $3,540 and $3,500.
Bitcoin price is consolidating above key supports against the US Dollar. BTC buyers are eyeing the next bullish break above the $3,600 resistance area in the near term.
Bitcoin Price Analysis
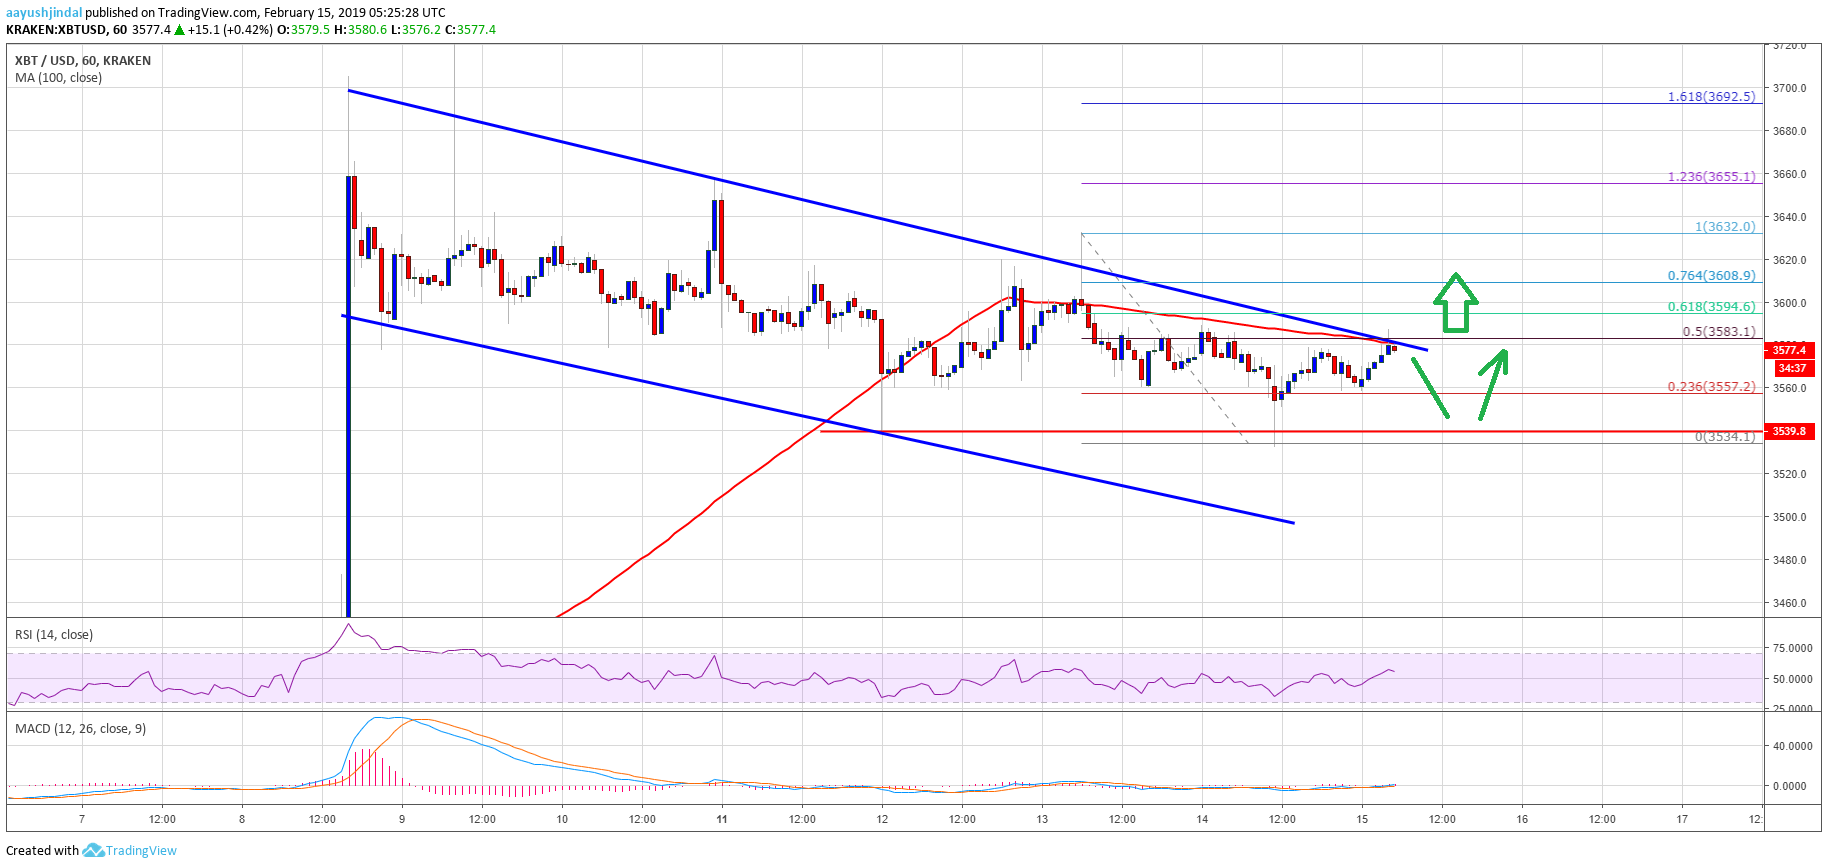
There were a couple of rejections noted near the $3,600 resistance in bitcoin price against the US Dollar. The BTC/USD pair declined recently and broke the $3,570 and $3,550 support levels. The price even broke the 61.8% Fib retracement level of the upward move from the $3,538 low to $3,635 high. However, the decline was protected by the key $3,540 support area. A low was formed near the $3,534 and later the price bounced back above the $3,550 level.
Buyers pushed the price above the 23.6% Fib retracement level of the recent decline from the $3,632 high to $3,534 low. However, there is a strong resistance formed near the $3,585 and $3,600 levels. The 100 hourly simple moving average is also near the $3,585 level. More importantly, there is a crucial declining channel in place with resistance at $3,585 on the hourly chart of the BTC/USD pair. Besides, the 50% Fib retracement level of the recent decline from the $3,632 high to $3,534 low is at $3,583.
Therefore, a break above the $3,585 and $3,600 resistance levels is a must for an upside acceleration. The next key resistance is near the $3,630 level, above which the price could rally towards the $3,700 level. An intermediate resistance is $3,655 and the 1.236 Fib extension level of the recent decline from the $3,632 high to $3,534 low.

Looking at the chart, bitcoin price seems to be facing a strong resistance near $3,600. There are two possible scenarios, first, the price breaks the channel resistance and trades towards the $3,630 and $3,655 levels. Second, it declines once again towards the $3,540 support. If there are more losses below $3,540, the next major support can be seen near the $3,500 level.
Technical indicators
Hourly MACD – The MACD is slightly placed in the bullish zone, with a few positive signs.
Hourly RSI (Relative Strength Index) – The RSI for BTC/USD is placed nicely above the 50 level, with a minor bearish angle.
Major Support Level – $3,540 followed by $3,500.
Major Resistance Level – $3,585 and 3,600.