

- Bitcoin price spiked above the key $3,860 resistance level, but it failed to gain pace against the US Dollar.
- The price is trading in a range below the $3,860 and $3,900 resistance levels.
- There is a short-term ascending channel in place with support at $3,800 on the hourly chart of the BTC/USD pair (data feed from Kraken).
- The pair could dip towards the $3,740 support level before a fresh rebound towards $3,860.
Bitcoin price is stuck in tiny ranges below the $3,860 resistance against the US Dollar. BTC could correct lower, but dips remain supported above the $3,740 and $3,720 levels.
Bitcoin Price Analysis
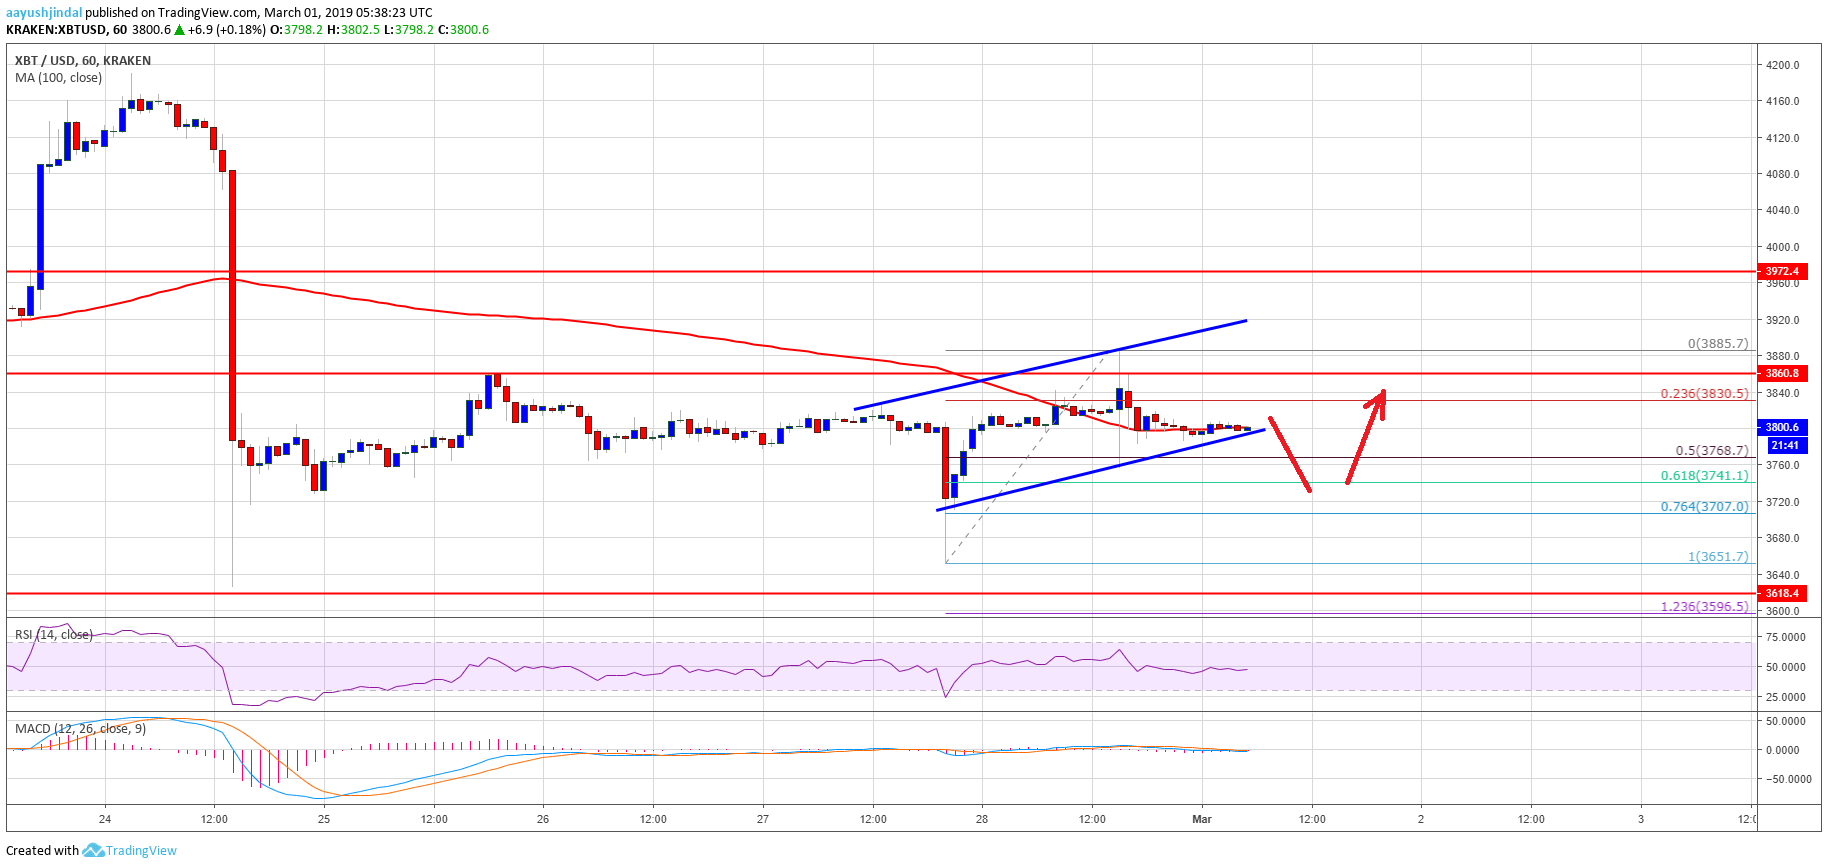
This week, we saw a strong resistance near the $3,860 level in bitcoin price against the US Dollar. The BTC/USD pair made a couple of attempts to break the $3,860 resistance, but it failed. There was even a bearish reaction below $3,700, but the price quickly recovered after trading as low as $3,651. It bounced back and settled above the $3,800 support level. Recently, there was a sharp upward move above the $3,860 resistance, but buyers failed to gain pace.
A swing high was formed at $3,885 and later the price trimmed gains. It broke the 23.6% Fib retracement level of the recent wave from the $3,651 low to $3,885 high. However, the $3,770 and $3,760 levels acted as supports. Besides, the 50% Fib retracement level of the recent wave from the $3,651 low to $3,885 high acted as a support. At the moment, the price is trading near the $3,800 support and the 100 hourly simple moving average. More importantly, there is a short-term ascending channel in place with support at $3,800 on the hourly chart of the BTC/USD pair.
The pair might break the channel support, but it could find support near the $3,750 or $3,740 level. The latter support represents the 61.8% Fib retracement level of the recent wave from the $3,651 low to $3,885 high. On the upside, the main resistance is at $3,860, followed by the $3,900 barrier. A successful close above $3,900 may perhaps open the doors for more upsides towards the $4,000 and $4,050 levels.

Looking at the chart, bitcoin price clearly stuck in a tiny range below the $3,860 resistance. There could be more range moves, with a bearish angle before buyers attempt to clear the $3,860 resistance. On the other hand, a break below $3,740 might push the price towards the $3,650 support.
Technical indicators
Hourly MACD – The MACD is mostly flat in the bullish zone.
Hourly RSI (Relative Strength Index) – The RSI for BTC/USD seems to be struggling to settle above the 50 level.
Major Support Level – $3,800 followed by $3,740.
Major Resistance Level – $3,850, $3,860 and 3,900.