

- Bitcoin price extended losses and traded below the $3,400 and $3,375 supports against the US Dollar.
- There was a break below a major bullish trend line with support at $3,405 on the hourly chart of the BTC/USD pair (data feed from Kraken).
- The price is trading with a bearish bias and it could extend declines below $3,350 and $3,320.
Bitcoin price failed to stay above $3,400 and extended decline against the US Dollar. BTC price broke the $3,375 support, opening the doors for more losses below the $3,320 support.
Bitcoin Price Analysis
There was a downside reaction after bitcoin price failed to trade above the $3,430 and $3,440 resistances against the US Dollar. The BTC/USD pair declined below the $3,400 support to move into a bearish zone. Sellers pushed the price below the 61.8% Fib retracement level of the last wave from the $3,372 low to $3,490 swing high. Finally, there was a break below the $3,375 support and the 100 hourly simple moving average.
Moreover, there was a break below a major bullish trend line with support at $3,405 on the hourly chart of the BTC/USD pair. The pair traded to a new weekly low at $3,350 and later corrected a few points. It traded above the 23.6% Fib retracement level of the recent decline from the $3,444 high to $3,350 low. The current price action is bearish and any upside correction towards the $3,400 level could find sellers. The main resistance is near the $3,400 level and the 50% Fib retracement level of the recent decline from the $3,444 high to $3,350 low. On the other hand, if the price resumes its decline, there could be a break below the $3,350 low.
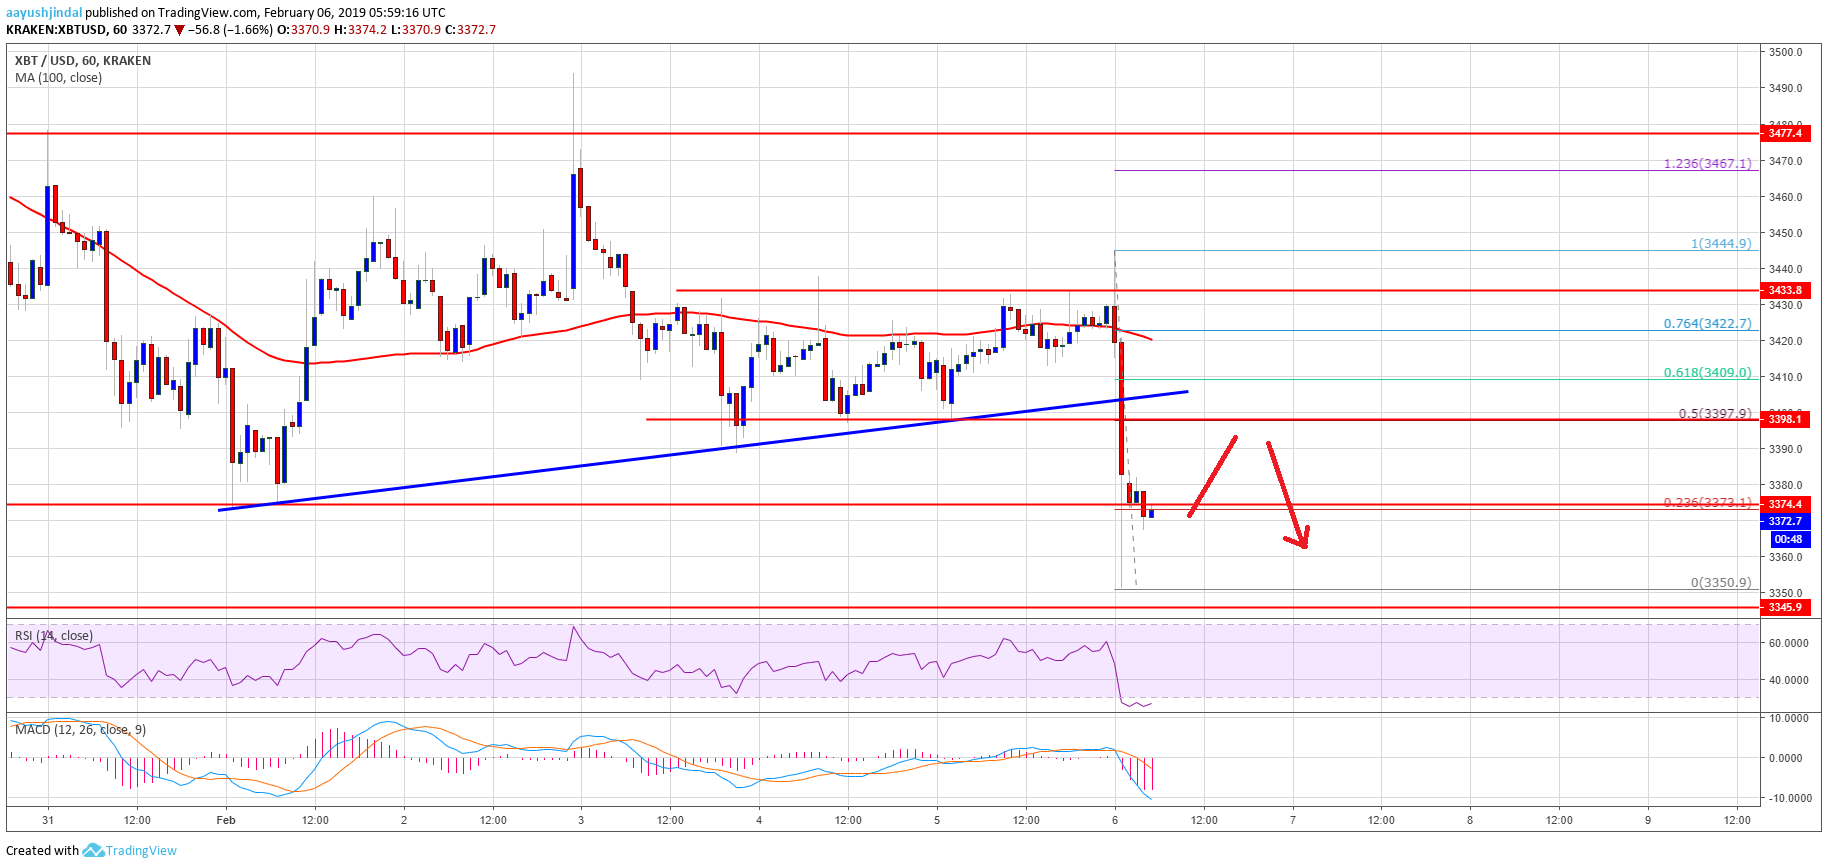

Looking at the chart, bitcoin price is clearly signaling bearish extension below the $3,375 and $3,350 levels. The next key support is at $3,320, below which the price might test the $3,200 level.
Technical indicators
Hourly MACD – The MACD is currently gaining strength in the bearish zone, with no sign of a recovery.
Hourly RSI (Relative Strength Index) – The RSI for BTC/USD is currently in the oversold levels, with neutral moves.
Major Support Level – $3,350
Major Resistance Level – $3,400